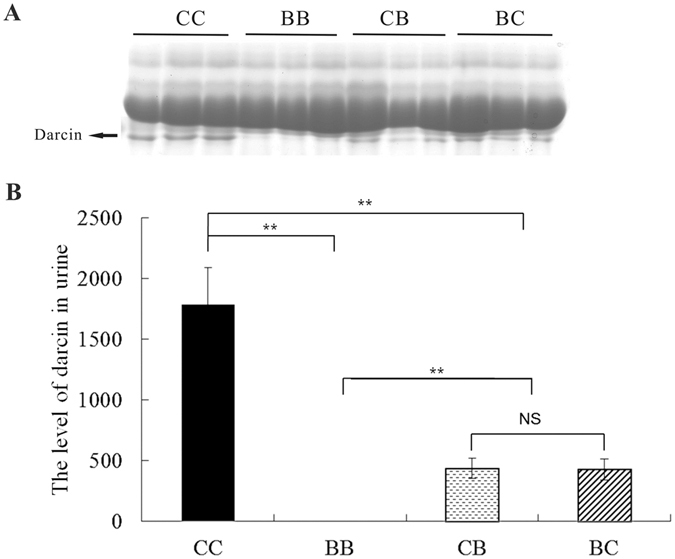
Figure 3.

SDS-PAGE of urine from F1 progeny. (A) Representative image, darcin is indicated by an arrow; (B) Band intensities of darcin from the SDS-PAGE were quantified using the Image J program. The data are represented as mean ± SE, n = 8 in each group. **Indicates significant difference of values at P < 0.01 by Student’s t test. BB: BALB/c strain; CC: C57BL/6 strain; BC: hybrid of BALB♀ × C57♂; CB: hybrid of C57♀ × BALB♂; NS: not significant.
