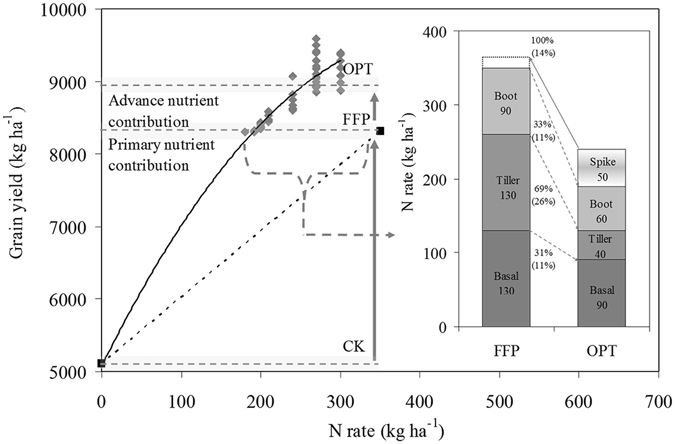
Figure 4.

Response curves of rice grain yield to N rate and the nutrient contribution stage; further details are in Sui et al.8. The result of improving rice grain yield and nitrogen use efficiency depended on the optimized N managements (OPT, insert figure) at different rice growth stages. The insert figure shows rice N management strategies between OPT and farmers’ fertilizer practices (FFP). The percentage and the dotted and solid arrows represent the N rate ratios of reduced or increased between OPT and FFP for the different and total growth stages in and out of parentheses, respectively.
