
Figure 1.
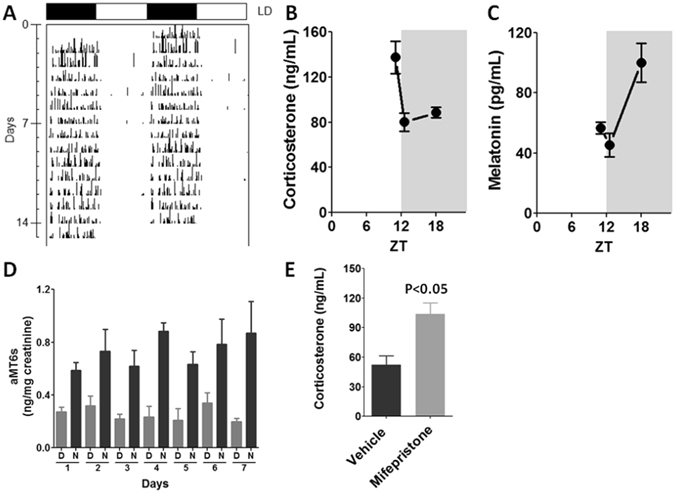
Daily rhythms in animals kept to a 12/12 h light/dark cycle. (A) Representative actogram of daily activity rhythm measured by means of water intake along 14 days. (B) Plasma levels of corticosterone at light/dark transition (ZT12L/ZT12D) and middle of the night (ZT18). (C) Plasma levels of melatonin at light/dark transition (ZT12L/ZT12D) and middle of the night (ZT18). (D) Daily rhythm of urinary excretion of 6-sulfatoxymelatonin (aMT6s) measured along 7 consecutive days during the day (D) and the night (N). (E) Effects of Mifepristone, a competitive antagonist of GR, in the plasma corticosterone levels measures at ZT18. The graphs show the mean ± SEM for 3–5 plasma hormone determinations or 4 urinary samples. Differences between groups were tested by Student’s t test.