
Figure 5.
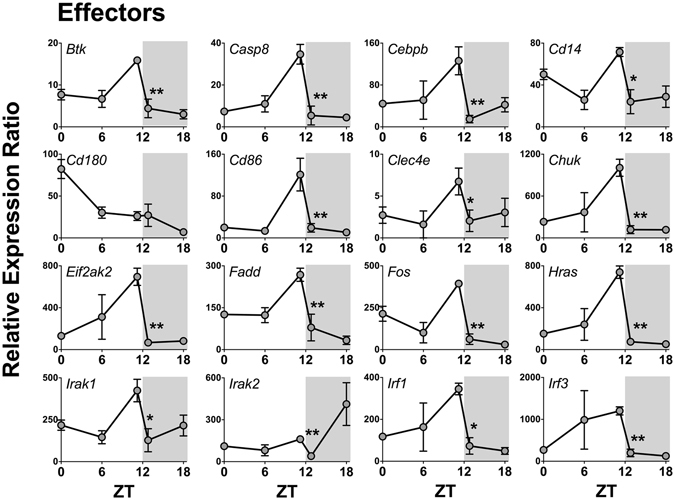
Daily pattern of gene expression coding for effectors of NFκB activation in rat pineal glands. Gene expression was determined by qPCR. Values are shown as the relative expression ratio normalized by the reference gene Rpl13. Each value represents the mean ± SEM of three independent arrays per ZT. The difference in gene expression between ZT12L and ZT12D were compared by independent Student “t” test. *P < 0.05, **P < 0.01, NS = P > 0.05.