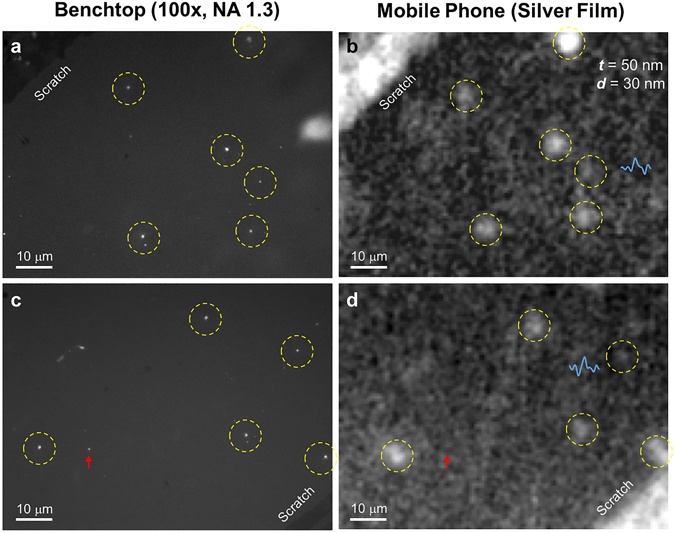
Figure 5.

Imaging of single QDs with our smartphone-based SEF microscope. (a,c) Single QDs imaged by a conventional benchtop microscope. (b,d) Same regions of interest imaged by the mobile SEF microscope, where the yellow dashed circles highlight the successful detection of single QDs on the mobile phone, and the red arrow represents a missed detection. Two intensity line scans, corresponding to weaker QDs, are also shown (blue curves).
