
Figure 1.
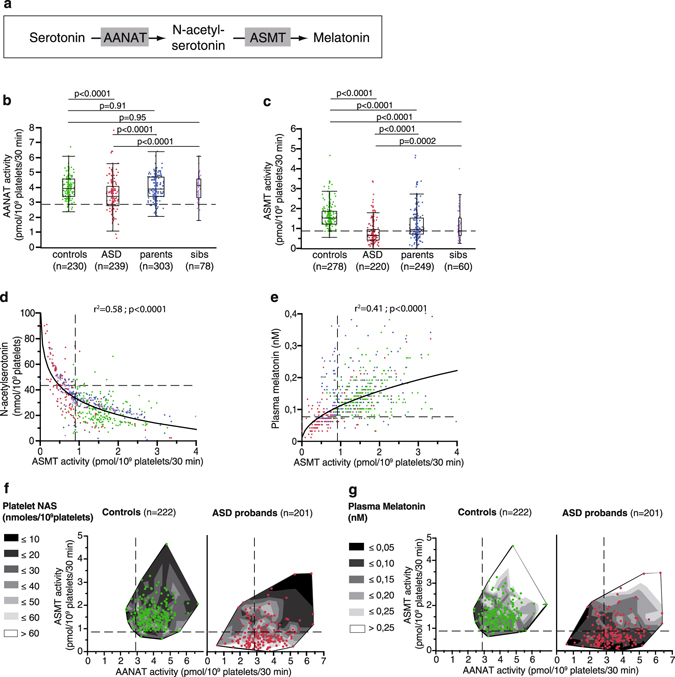
Exploration of the serotonin-melatonin pathway in the blood. (a) The serotonin and melatonin synthesis pathway. (b) Platelet AANAT activity. (c) Platelet ASMT activity. (d) Correlation between platelet NAS concentration and ASMT activity (regression after log transformation of ASMT, n = 579). (e) Correlation between plasma melatonin and platelet ASMT activity (regression after log transformation of melatonin and ASMT, n = 641). (f) Contour plot of platelet NAS concentration, AANAT and ASMT activities in patients (red dots) and controls (green dots). (g) Contour plot of plasma melatonin concentration, platelet AANAT and ASMT activities in patients (red dots) and controls (green dots). Blood samples were taken in the morning from 239 individuals with ASD, their first-degree relatives (303 parents and 78 unaffected sibs), and 278 controls. Boxes indicate medians and quartiles. Dashed lines indicate the threshold of the 95th (for NAS) or 5th (for melatonin, AANAT and ASMT) percentile of the control group. Groups were compared using the Wilcoxon two-sample test.