
Figure 2.
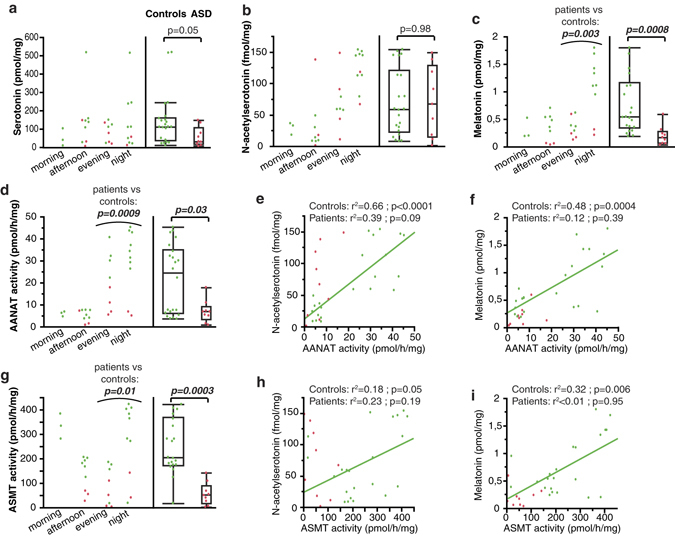
Characterization of the serotonin-melatonin pathway in autopsy-derived pineal gland samples from 9 individuals with ASD and 22 controls. (a) Serotonin content. (b) NAS content. (c) Melatonin content. (d) AANAT activity. (e) Correlation between NAS content and AANAT activity and regression line (green) for the control group (regression after log transformation of AANAT). (f) Correlation between melatonin content and AANAT activity, and regression line for the control group (green). (g) ASMT activity. (h) Correlation between NAS content and ASMT activity, and regression line for the control group (green). (i) Correlation between melatonin content and ASMT activity, and regression line for the control group (green). The ASD group was compared to the control group using Wilcoxon two-sample test. Boxes indicate medians and quartiles.