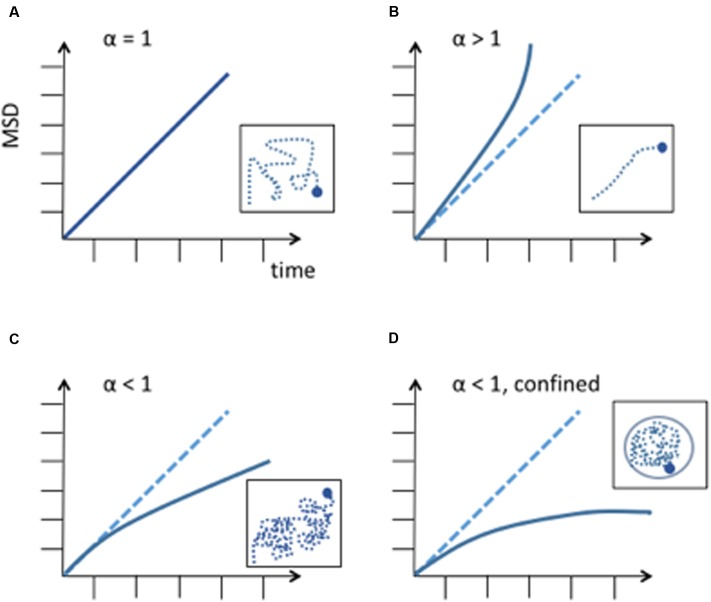
FIGURE 1.
Different diffusion behaviors of a particle. MSD is expressed in μm2. (A) Random diffusion of a particle, this corresponds to Brownian motion. (B) Anomalous diffusion described by a power law with α > 1. This corresponds to super-diffusion or directed motion. (C) Anomalous diffusion described by a power law with α < 1, subdiffusion. A subdiffusive behavior has been observed in most chromosome dynamics studies. (D) Subdiffusion in a confined space. When a chromosome locus encounters a boundary, the curve of the MSD reaches a plateau. Differences in measurements can be explained by chromosome loci position along the chromosome and to its tethering to nuclear structures, like the nuclear envelope or nuclear microtubules.

