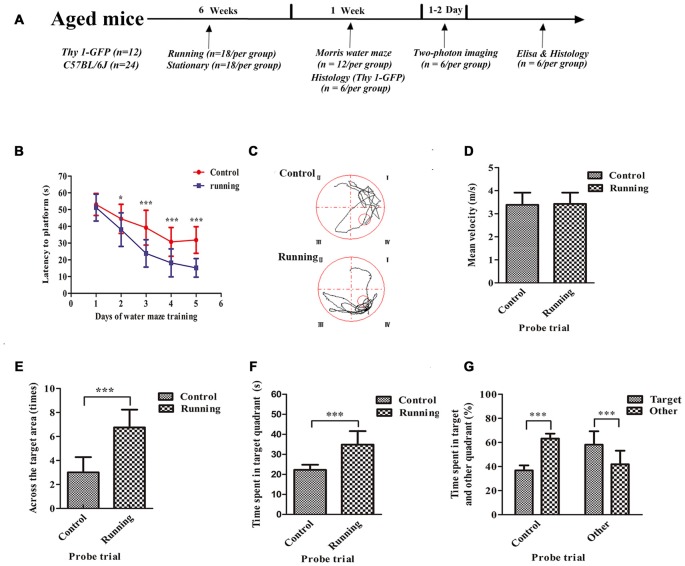
Figure 1.
Schematic diagram of the timeline of this study and the effects of voluntarily running on spatial memory in a water-maze task. (A) Timeline of the behavioral tests and biochemical parameters used in this study. (B) Time to reach the platform in the control and running groups during Morris water-maze training. (C) Representative swim paths of mice in the control and running groups during the probe trial. (D) Mean velocities of mice in the control and running groups during the probe trial. (E) Number of times the target area (former platform) was crossed in the control and running groups during the probe trial. (F,G) Time (F) and % time (G) spent in the target quadrant (formerly contained the platform) in the control and running groups during the probe trial. Datasets are expressed as means ± SD, n = 12. *P ≤ 0.05; ***P ≤ 0.001.

