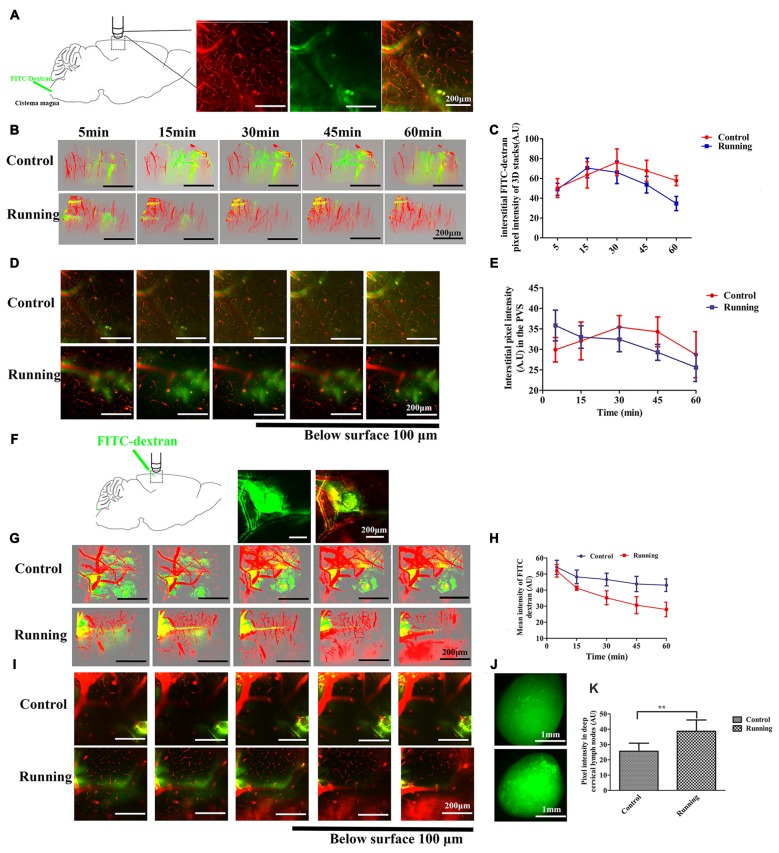
Figure 2.
Analysis of two-photon microscopy data on glymphatic clearance, including the influx through paravascular space (PVS)–interstitial fluid (ISF) exchange and the efflux through ISF drainage. (A) Schema showing the infusion of the fluorescein isothiocyanate (FITC)-dextran tracer into the cisterna magna for in vivo two-photon imaging (250×, scale bar = 200 μm). (B) Three-dimensional (3D) images of the brain vasculature and the distribution of the cerebrospinal fluid (CSF) tracer at different time points in the control and running groups (250×, scale bar = 200 μm). (C) Quantitative analysis of the mean pixel intensity of the tracer in the 3D image stacks in (B), which shows that the influx and clearance of the CSF tracer were markedly accelerated in the running group compared with the control group (n = 6 per group). (D) Representative image of the CSF tracer along the perivascular spaces penetrating into the brain parenchyma, 100 μm below the cortical surface (250×, scale bar = 200 μm). (E) Quantitative analysis of the fluorescence intensity of the CSF tracer in the PVS shown in (D) (n = 6 per group). (F) Schema showing the dissipation of the FITC-dextran tracer in the brain parenchyma during in vivo two-photon imaging, which indicates the efflux of the glymphatic system (100×, scale bar = 200 μm). (G) Representative 3D images of dye alignment at different time points in the control and running groups (250×, scale bar = 200 μm). (H) Comparison of the average fluorescence intensity in the parenchyma of the control and running groups at different time points (n = 6 per group). (I) Representative image of the dye alignment along the PVS, 100 μm below the cortical surface (250×, scale bar = 200 μm). (J) Representative image of the ISF drainage into the deep cervical lymph nodes in the control and running groups at 1 h after FITC-dextran was injected into the brain parenchyma (50×, scale bar = 1 mm). (K) Comparison of the average fluorescence intensity in the deep cervical lymph nodes of the control and running groups (n = 6 per group). Datasets are expressed as means ± SD, n = 6. **P ≤ 0.01.

