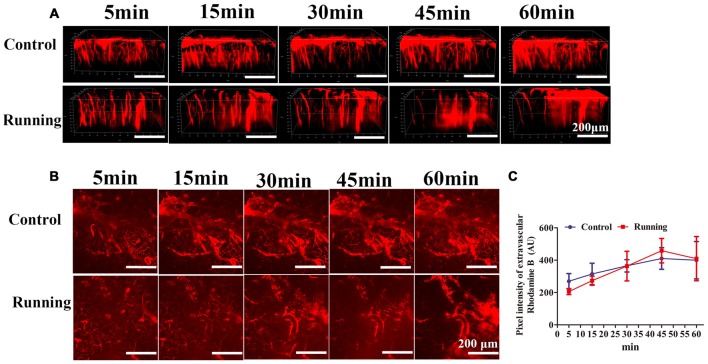
Figure 4.
Effects of voluntarily running on the permeability of the blood–brain barrier (BBB). (A) 3D reconstructed images of the brain vessels at different time points after rhodamine B was injected into the mouse tail vein. (B) xyz stacks of the brain vessels at different time points, indicating dye permeation. (C) Line diagram of the pixel intensity in the extravascular compartment. Datasets are expressed as means ± SD, n = 6.

