Figure 6.
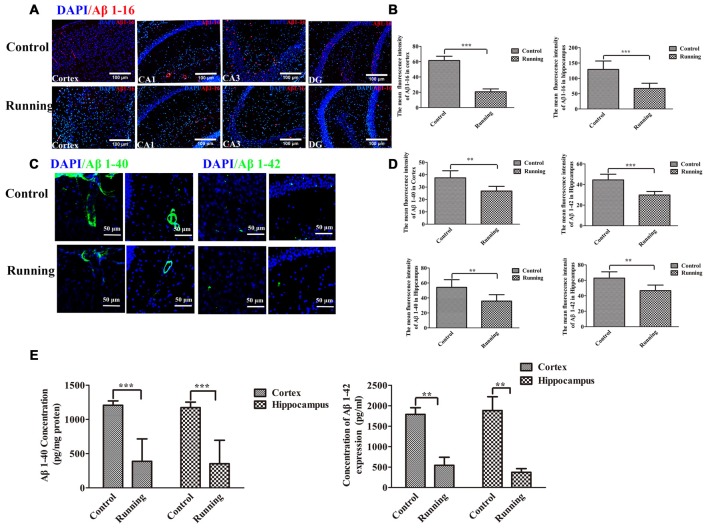
Effect of voluntarily running on amyloid β accumulation. (A) Immunofluorescent staining of Aβ1–16 in the control and running groups (200×, scale bar = 100 μm). (B) Histograms comparing the average Aβ1–16 fluorescence intensity in the cortex and hippocampus in the control and running groups (n = 6 per group). (C) Immunofluorescent staining of Aβ1–40 and Aβ1–42 in the control and running groups (250×, zoomed in three-fold, scale bar = 50 μm). (D) Histograms comparing the average Aβ1–40 and Aβ1–42 fluorescence intensity in the cortex and hippocampus in the control and running groups (n = 6 per group). (E) Comparison of the Aβ1–40 and Aβ1–42 levels detected with enzyme-linked immunosorbent assays (ELISAs). Datasets are expressed as means ± SD, n = 6. **P ≤ 0.01; ***P ≤ 0.001.

