Figure 3.
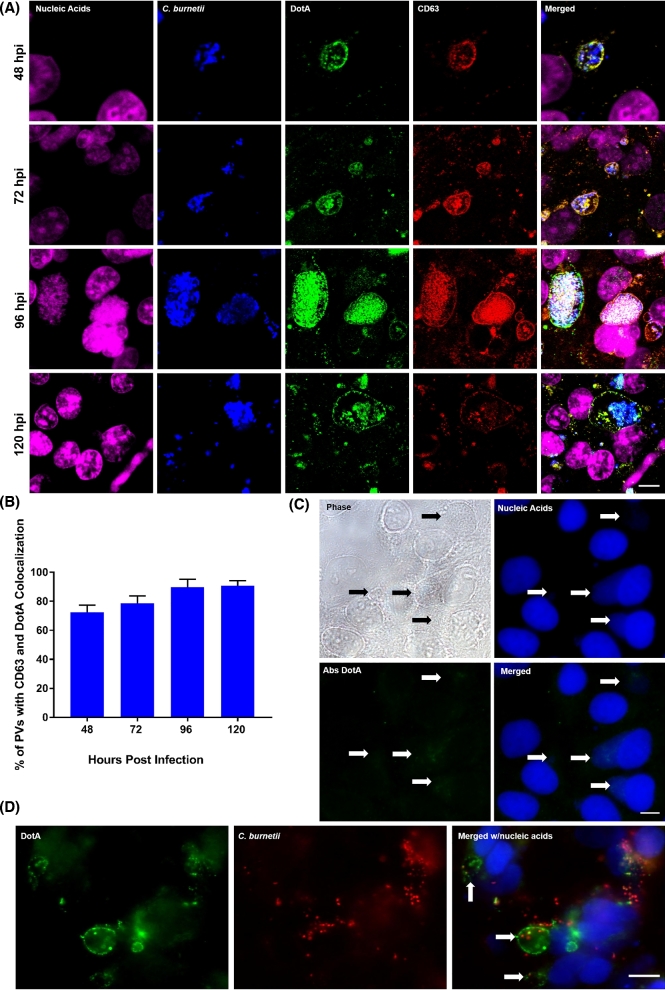
Temporal analysis of DotA localization during infection of host cells, specificity of DotA antibody and DotA staining using virulent C. burnetii. (A) Representative fluorescence micrographs of HeLa cells infected with C. burnetii over the course of infection. Infections were initiated with C. burnetii SCVs and fixed at 48, 72, 96 and 120 hpi. Fixed cells were labeled for total nucleic acids (pseudo-colored pink), C. burnetii (pseudo-colored blue), DotA (green) and CD63 (red). DotA is detectable by 48 hpi and in the merged images remains colocalized with CD63 through the course of infection. Scale bar equals 10 μm. (B) The average number of infected cells with PVs that were positive for CD63 and DotA colocalization enumerated from 100 infected cells from three separate replicates at 48, 72, 96, and 120 hpi. The percentage of PVs with CD63 and DotA colocalization remains consistent through the course of infection. (C) Representative phase contrast and fluorescent micrograph of infected Vero cells. Vero cells were fixed at 96 hpi and probed with antibodies against DotA that were previously absorbed with rDotA (Abs DotA). Arrows indicate the PV within the infected cells. No DotA staining is observed in the infected cells. Scale bar equals 10 μm. (D) Representative fluorescence micrographs of RK13 cells infected with C. burnetii NMI. RK13 cells were fixed at 72 hpi and labeled for DotA (green), C. burnetii (red) and total nucleic acids (blue). DotA staining appears at the PV membrane (arrows) as observed with the avirulent C. burnetii NMII-infected HeLa and Vero cell lines. Scale bar equals 10 μm.

