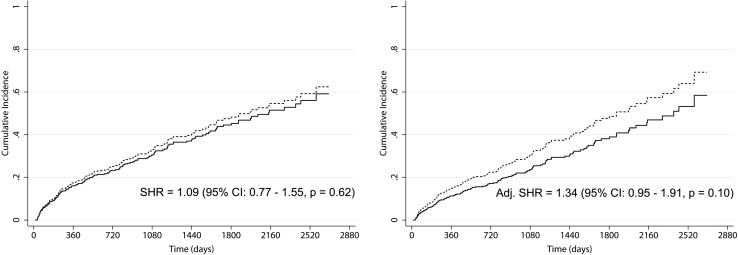
Fig. 1.
Cumulative incidence function of hemodialysis (HD, continuous line) and peritoneal dialysis (PD, dashed line) patients from 2008 to 2014, provided by crude (left) and adjusted (right) competing-risks regression models. In the model the event of interest was death and the competing event was transplantation. Adjustment was performed for age-group, cardiovascular disease, diabetes mellitus, and arterial hypertension

