
Fig. 3.
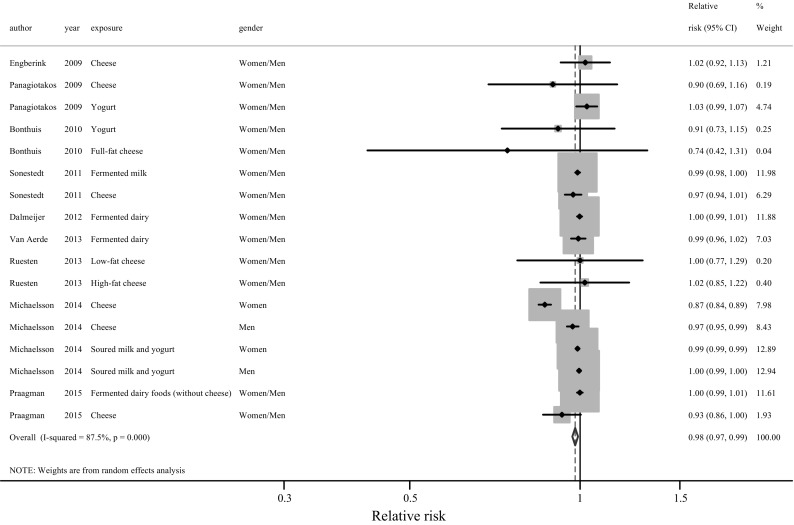
Relative risk of CVD for an increment of 20 g/day of fermented dairy intake. Squares represent study-specific RR. Square areas are proportional to the overall specific-study weight to the overall meta-analysis. Horizontal lines represent 95% Cis. Diamonds represent the pooled relative risk and 95% CIs. By excluding the Swedish study [6] of women’s results for cheese, RR = 0.99 (95% CI 0.99–1.00), I2 = 23.8% (P = 0.19)