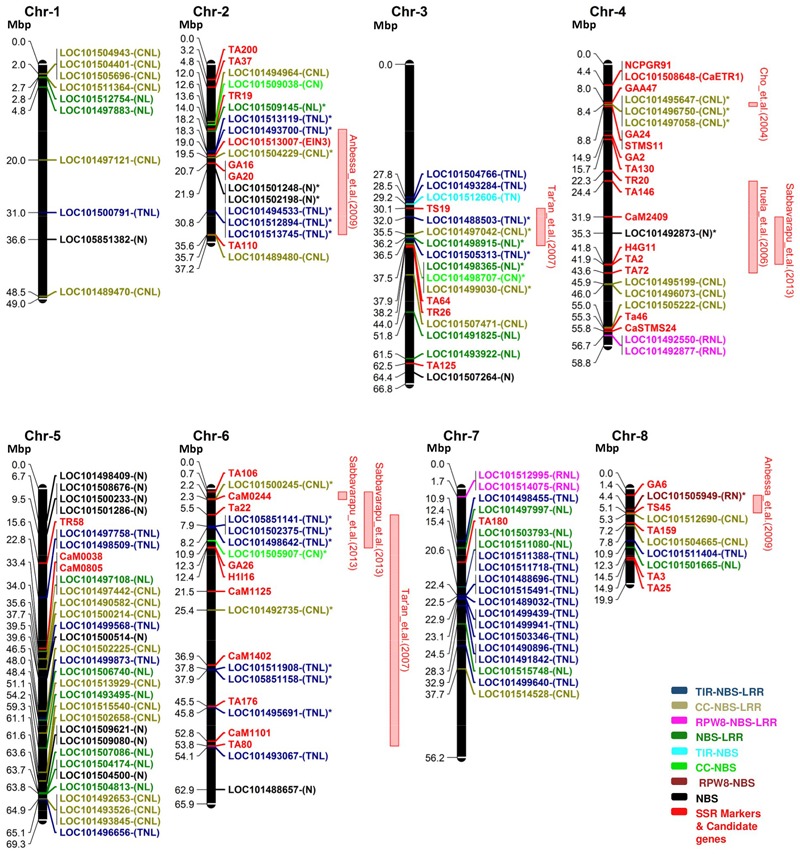
FIGURE 4.

The distribution of NBS-LRR genes on the physical map of CDC Frontier v2 along with the position of the markers corresponding to the physical positions of the quantitative trait loci (QTLs) for ascochyta blight resistance. Eight chromosomes (Chr) of chickpea were represented as black bars. Gene and marker names are shown on the right-handed side and their physical positions in megabase pair (Mbp) are shown on the left. Color codes are defined in the legend. QTLs with co-localized NBS-LRR genes were shown as red bars on the right side of the chromosomes. Co-localized NBS-LRR genes are shown with (∗) along with their name. We identified 30 NBS-LRR genes co-localized within the nine QTLs for ascochyta blight resistance.
