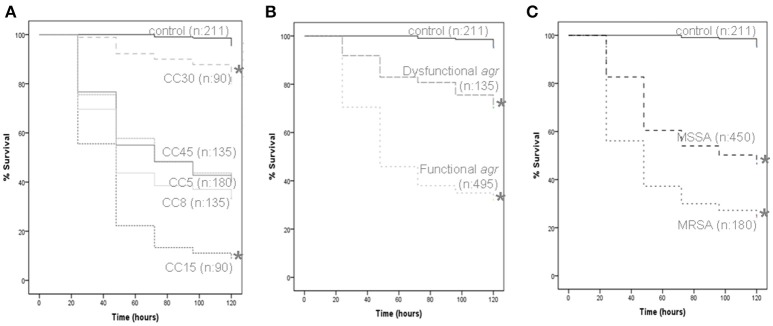
Figure 5.
G. mellonella virulence assay. Data from a minimum of three experiments per strain were plotted on Kaplan-Meier survival curves and a log-rank test was used to determine significance. All data grouped according to CC (A), agr functionality (B), and methicillin resistance (C). The number of larvae included in each group is indicated (n). Significance is indicated with asterisks, *p < 0.001.

