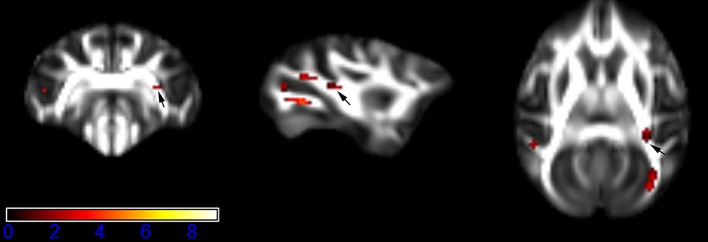
Figure 6.
Areas in retrolenticular limb of the internal capsule (RLIC, right side) with reduced fractional anisotropy values in the chronic ketamine exposure group compared to controls at p < 0.005 (in red; uncorrected). The anatomical underlay is DTI-based monkey brain image template (UWRMAC-DTI271) FA map with white matter atlas. Figure from left to right side is coronal view, sagittal view, and axial view of the images, respectively. The color bar represents the t-value.

