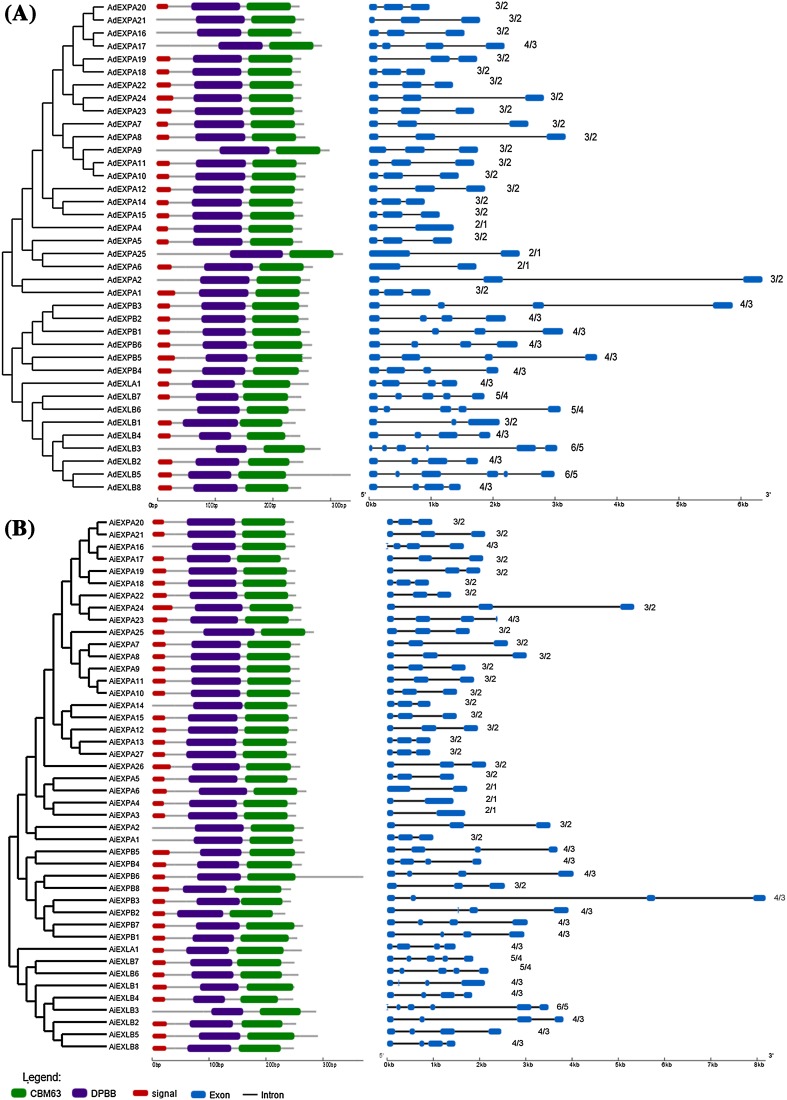
Fig. 2.
Protein and exon/intron gene structure of expansins in a Arachis duranensis and b Arachis ipaënsis. Protein structure diagram (left): DPBB and CBM63 domains are represented by purple and green boxes, respectively, and peptide signals by red boxes. Gene structure diagram (right): exons are represented by blue boxes and introns by linking single lines. The number of introns and exons, respectively, is after each diagram

