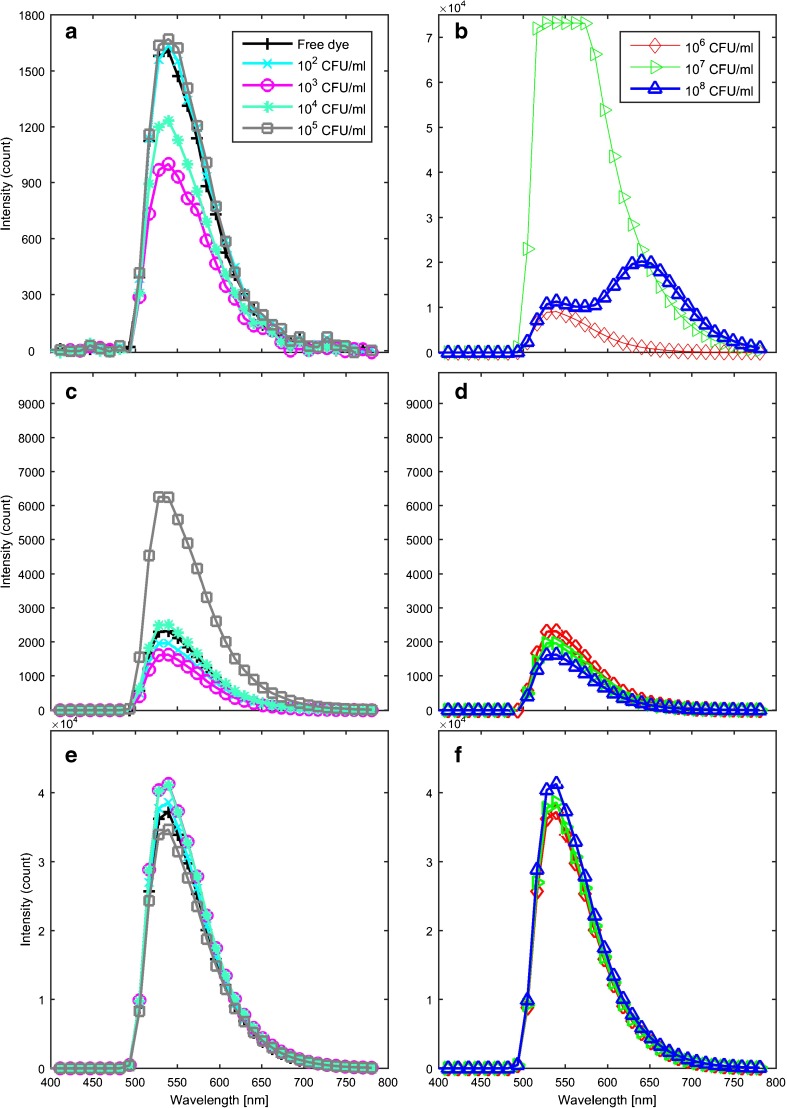
Fig. 1.
Exemplar spectra collected for (a) and (b) 2 × 10⁻²% AO staining followed by 3 washing cycles (c) and (d) 2 × 10⁻³% AO staining followed by two washing cycles and (e) and (f) 2 × 10⁻⁴% AO staining for 0–105 CFU ml−1 E. coli in (a, c and e), and for 106−108 CFU ml−1 E. coli in (b, d and f). Spectra are coloured by concentration: blue 108, green 107, red 106, grey 105, mint green 104, magenta 103, cyan 102, black 0 CFU ml−1

