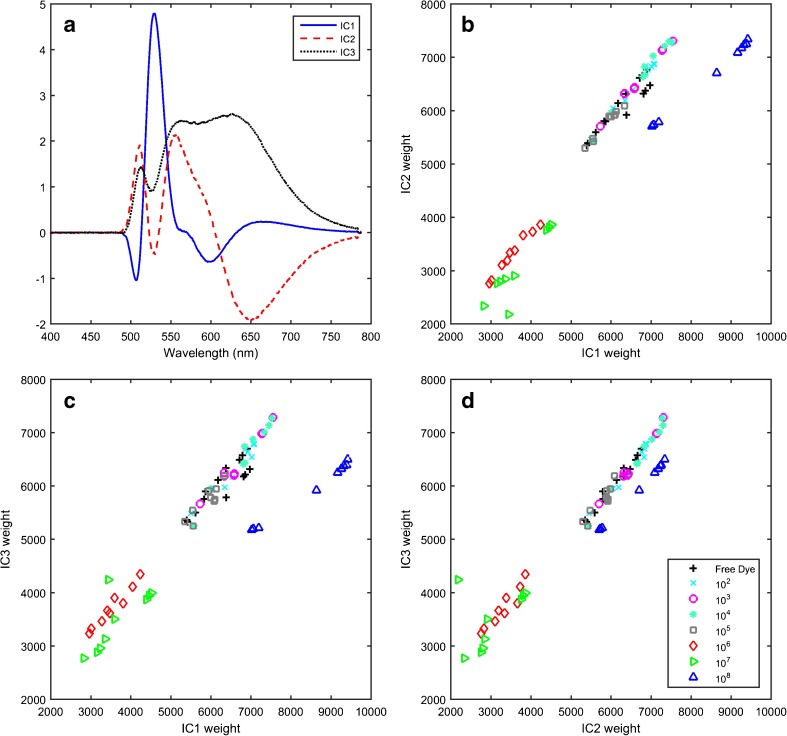
Fig. 3.
Independent component (IC) 1 (solid), IC2 (dashed) and IC3 (dotted) signals (a) and weights (b–d) obtained from the 2 × 10⁻⁴% AO staining procedure (N = 26, n = 76). Samples in (b), (c) and (d) are coloured by concentration following the colour scheme of Fig. 1 and use the following symbols: upward-pointing triangle 108, left-pointing triangle 107, diamond 106, square 105, asterisk 104, circle 103, cross 102, plus sign 0 CFU ml−1

