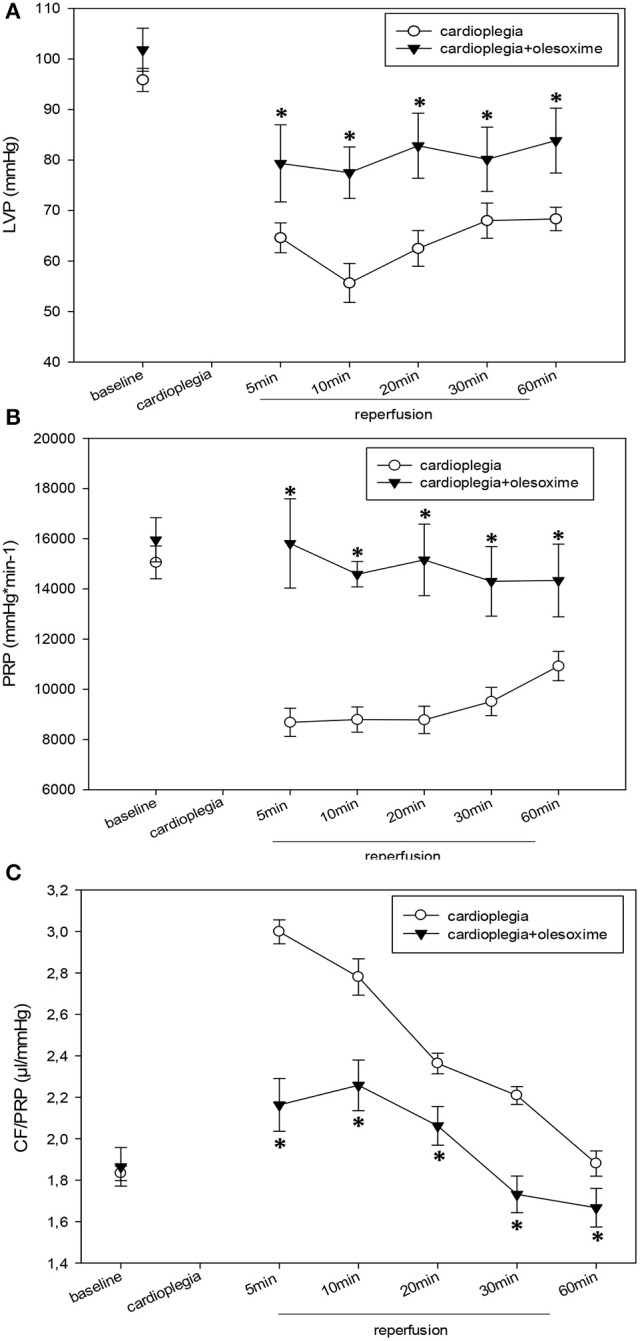
Figure 1.

(A). Left ventricular pressure (LVP) in mmHg before (baseline) and during recovery from a 90 min period of cardioplegia. Cardioplegia was performed either without (white circles, n = 7) or with addition of 5 μmol/L olesoxime (black triangles, n = 7). All data are given as means ± SEM. Significant differences (p < 0.05) between CP− and CP+ are indicated by asterisks (*). (B) End-diastolic pressure (EDP) in mmHg before (baseline) and during recovery from a 90 min period of cardioplegia. Cardioplegia was performed either without (white circles, n = 7) or with addition of 5 μmol/L olesoxime (black triangles, n = 7). All data are given as means ± SEM. Significant differences (p < 0.05) between CP− and CP+ are indicated by asterisks (*). (C) Pressure-rate-product (PRP) in mmHg*min−1 before (baseline) and during recovery from a 90 min period of cardioplegia. Cardioplegia was performed either without (white circles, n = 7) or with addition of 5 μmol/L olesoxime (black triangles, n = 7). All data are given as means ± SEM. Significant differences (p < 0.05) between CP− and CP+ are indicated by asterisks (*).
