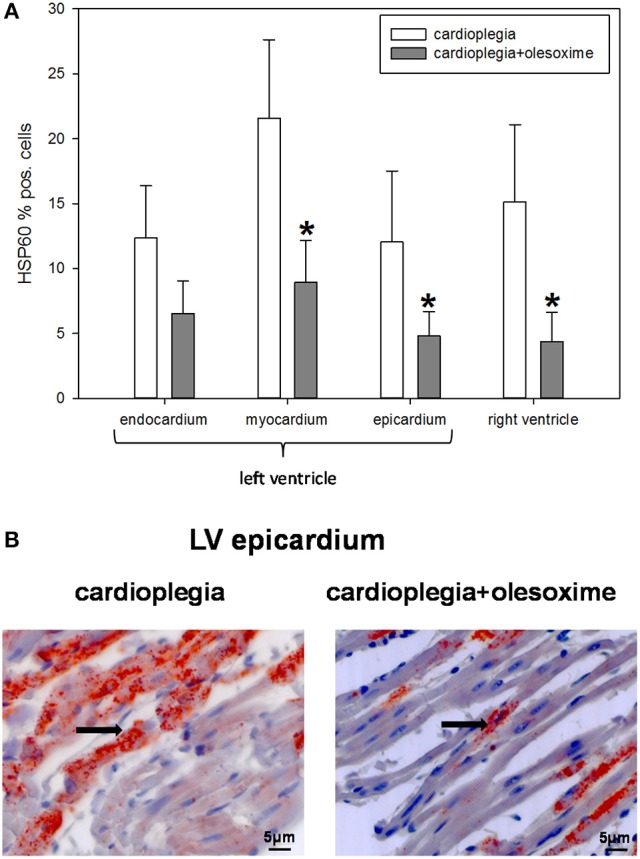
Figure 6.

(A) Staining and quantification of HSP60 (heat shock protein 60) expression. Bar graphs depict percentage of cells positively stained for HSP60 in specimens from left ventricular epicardium, myocardium and endocardium and right ventricle after 90 min of cardioplegia followed by 60 min of recovery. All data are given as means ± SEM. Significant differences (p < 0.05) between CP− and CP+ are indicated by asterisks (*). (B) Original HSP60-staining of left ventricular (LV) epicardium. Arrows indicate cells positive for HSP60 (stained in red).
