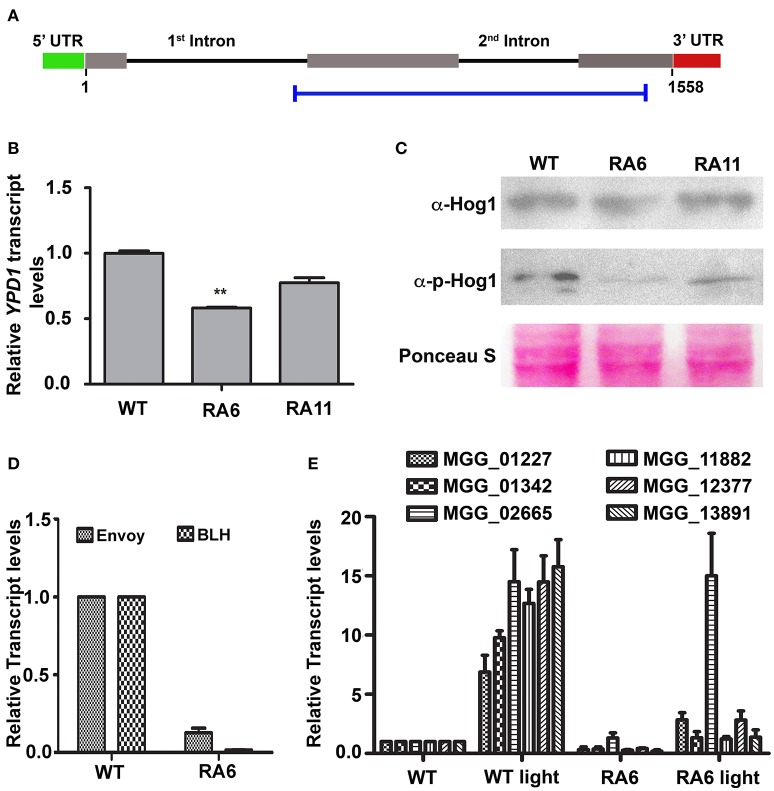
Figure 3.
Down-regulation of YPD1 and its downstream effects in M. oryzae. (A) A schematic representation of the genomic locus of the YPD1 open reading frame. The horizontal blue bar denotes the stretch of nucleotide sequence used to make a YPD1 KD construct. (B) A bar graph representing relative YPD1 transcript levels in the indicated KD transformants. Data represent mean ± s.e.m. from three independent experiments. **P < 0.01. (C) Western blot analyses showing relative expression level of unphosphorylated or phosphorylated Hog1 protein detected using the relevant indicated antibodies. The blots were stained with Ponceau S to confirm normalization of protein samples. (D) Relative transcript levels of the indicated genes, between the WT or KD transformant RA6, are depicted in a bar graph. Data represent mean ± s.e.m. from three independent assays performed using total RNA from vegetative cultures of the indicated strains of M. oryzae. (E) A bar graph showing relative transcript levels of the indicated PAS-domain HKs in the WT or RA6 KD transformant grown under light or dark condition. Data represents mean ± s.e.m. from three individual experiments.

