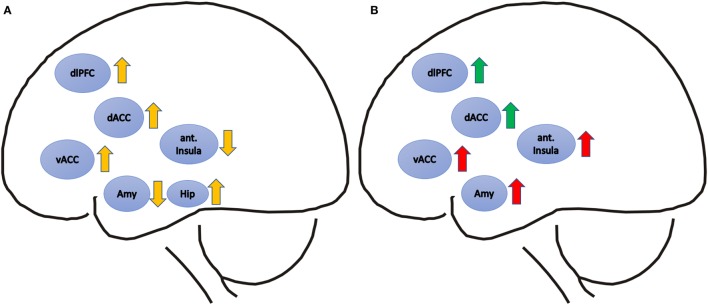
Figure 1.
(A) Pre-to-post-treatment signal differences in post-traumatic stress disorder patients are depicted with yellow arrows. Upward arrows represent relatively increased, downward arrows relatively decreased activation after treatment. (B) Positive correlations of pre-treatment functional magnetic resonance imaging (fMRI) activity and symptom improvement are depicted with green arrows, and positive correlations of pre-treatment fMRI activity and symptom persistence are depicted with red arrows. Brain regions: dACC, dorsal anterior cingulate cortex; vACC, ventral anterior cingulate cortex; ant. Insula, anterior Insula; dlPFC, dorsolateral prefrontal cortex; Amy, amygdale; Hip, hippocampus.

