Figure 7.
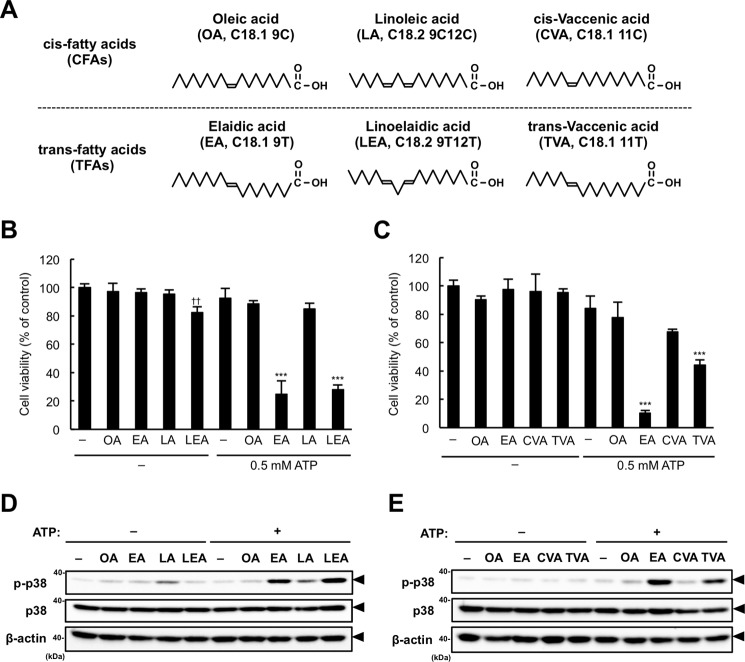
Other TFAs also induce ATP-induced cell death. A, structures of the fatty acids tested. In parentheses, the following information about fatty acids is shown in a conventional manner: abbreviation, the number of carbon atoms, the number of carbon-carbon double bonds, and the positions of double bonds from the carboxyl-terminal. T, trans; C, cis). B and C, RAW264.7 cells were pretreated with the indicated fatty acids at 200 μm for 12 h, stimulated with 0.5 mm ATP for 6 h, and then subjected to a cell viability assay. The data shown are the mean ± S.D. Significant differences were determined by one-way ANOVA followed by Tukey-Kramer test. ††, p < 0.01 (versus control without ATP); ***, p < 0.001 (versus control with 0.5 mm ATP). D and E, RAW264.7 cells were pretreated with the indicated fatty acids at 200 μm for 12 h and then stimulated with 0.5 mm ATP for 1 h. Cell lysates were subjected to immunoblotting with the indicated antibodies. Arrowheads indicate bands corresponding to the indicated proteins.

