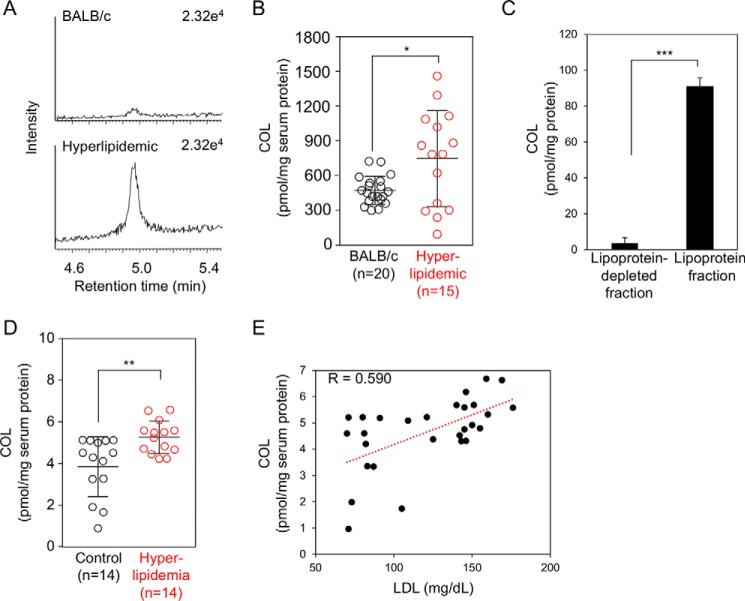
Figure 12.
Quantification of COL adduct in vivo. A and B, formation of COL adduct in the sera from control and spontaneously hyperlipidemic mice. *, p < 0.05. C, formation of COL adduct in lipoproteins factions from spontaneously hyperlipidemic mice. ***, p < 0.005. D, formation of COL adduct in the sera from normal subjects and patients with hyperlipidemia. **, p < 0.01. E, correlation between the levels of COL and those of LDL.

