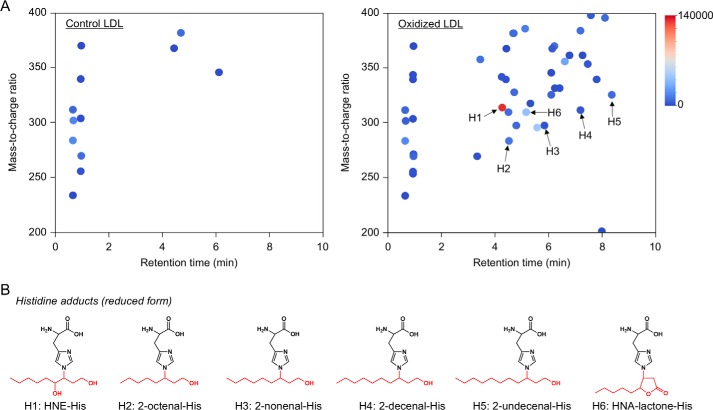
Figure 4.
Adductome analysis of histidine adducts detected in the oxidized LDL. A, adductome maps of histidine adducts detected in the control (left) or Cu2+-oxidized LDL (right). The adductome maps are shown with a color gradient encoding the relative abundance from blue (low) to red (high). The known histidine adducts are indicated by arrows labeled H1–H6. B, chemical structure of histidine adducts (H1–H6) detected in the Cu2+-oxidized LDL.

