Figure 3.
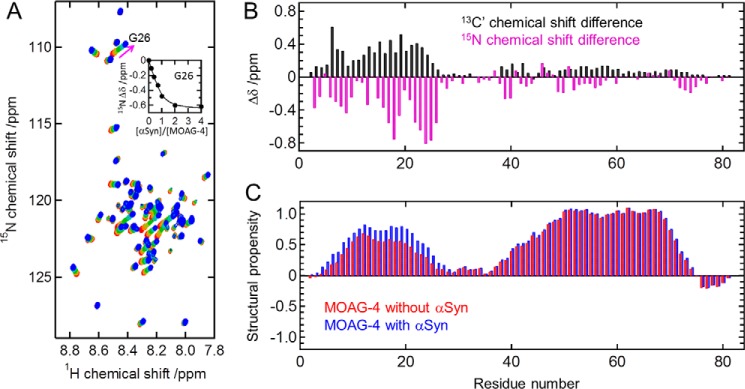
The amino terminus of MOAG-4 interacts with α-Syn. A, changes in the 1H-15N HSQC spectra of MOAG-4 for increasing amounts of α-Syn. [α-Syn]/[MOAG-4] = 0, 0.2, 0.4, 0.7, 1, 2, and 4 (from red to blue). The inset in panel A is the binding curve for Gly26. The solid line was obtained by global fitting of the chemical shift changes to Equation 1. B, backbone 13C′ (black) and 15N (magenta) chemical shift changes of MOAG-4 upon binding to α-Syn. The precision error is less than 0.03 ppm. C, structural propensity of MOAG-4 in the absence (red) and presence (blue) of α-Syn obtained from the backbone 1HN, 15N, and 13C′ chemical shifts.

