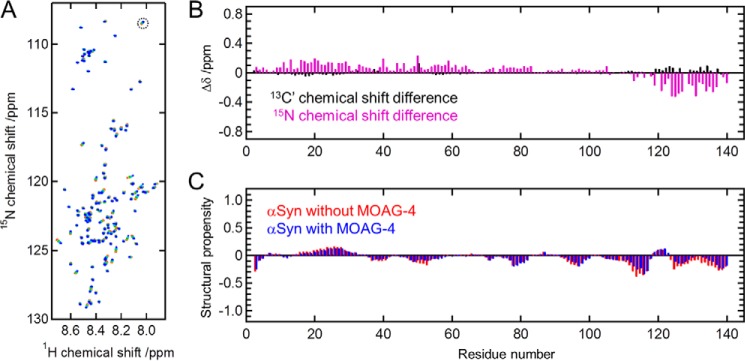
Figure 4.
The structure of α-Syn is affected in several regions upon interaction with MOAG-4. A, BEST-TROSY 1H-15N correlation spectra of α-Syn (45 μm) with an increasing amount of unlabeled MOAG-4. [MOAG-4]/[α-Syn] = 0, 0.3, 0.8, 1.8, and 5.2 (from red to blue). The cross-peak for Ala140, indicated by a dashed circle, is aliased in the 15N dimension. B, backbone 13C′ (black) and 15N (magenta) chemical shift changes of α-Syn upon binding to MOAG-4. The precision error is less than 0.03 ppm. C, structural propensity of α-Syn in the absence (red) and presence (blue) of MOAG-4 obtained from the backbone 1HN, 15N, and 13C′ chemical shifts.

