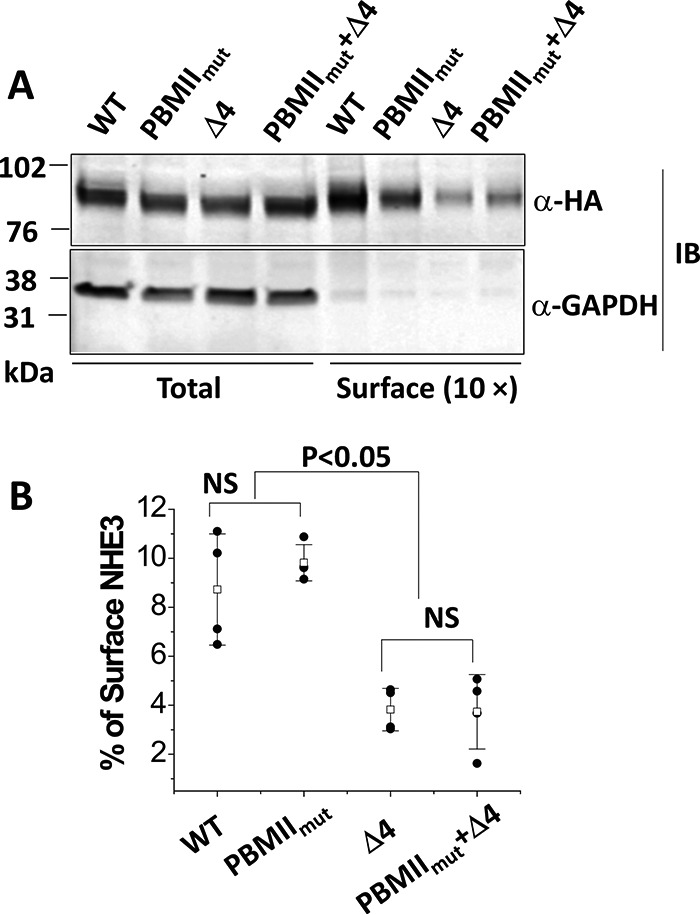
Figure 5.

Cell surface expression of NHE3 WTΔ4 and NHE3 PBMIImut + Δ4 was dramatically decreased, whereas the NHE3 PBMIImut mutant was expressed on the plasma membrane similarly to NHE3 WT. A, representative Western blots of NHE3 WT, NHE3 PBMIImut, NHE3 Δ4, and NHE3 PBMIImut + Δ4 were quantified with total and surface fractions probed with monoclonal anti-HA antibody and visualized with the Odyssey system. The density of each band was determined by Image Studio software. B, summary of surface levels (as percentage of total) of NHE3 WT, PBMIImut, Δ4, and PBMIImut + Δ4. Experiments were repeated three times, and results are shown as mean ± S.D. Error bars represent S.D. NS, not significant.
