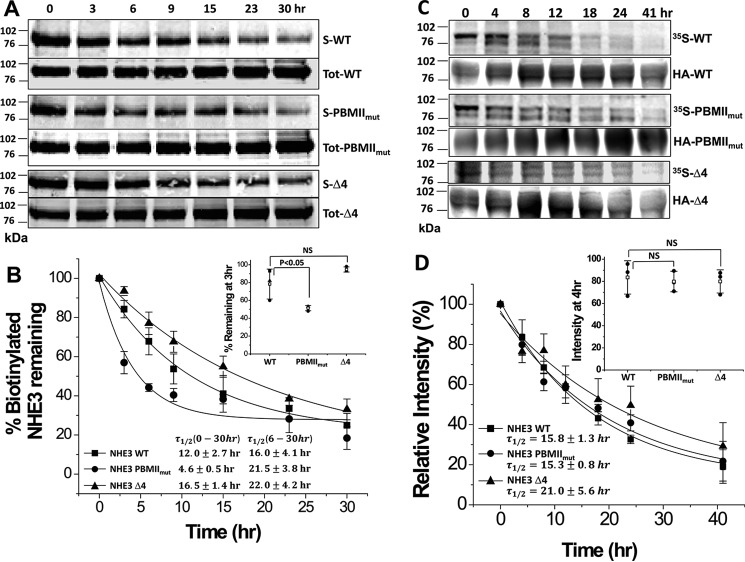
Figure 8.
The half-life of plasma membrane NHE3 PBMIImut but not that of NHE3 Δ4 is decreased compared with NHE3 WT, but the total half-lives of NHE3 PBMIImut and NHE3 Δ4 are similar to NHE3 WT. A, half-lives of plasma membrane NHE3 WT, NHE3 PBMIImut, and NHE3 Δ4 in PS120/NHERF2 cells were estimated using cell-surface biotinylation. Plasma membrane NHE3 WT, NHE3 PBMIImut, and NHE3 Δ4 were biotinylated at 4 °C, and the biotin-labeled NHE3 was collected at varying times (from 0 to 30 h) after incubation at 37 °C. The biotinylated NHE3 WT, NHE3 PBMIImut, and NHE3 Δ4 were quantified using the Odyssey system. Results from a single experiment are shown. B, graph shows quantitation of biotinylated surface (S) NHE3s normalized by total NHE3s (S-NHEs/Tot-NHE3s) for NHE3 WT (■), NHE3 PBMIImut (●), and NHE3 Δ4 (▴). The percentage of biotinylated NHE3 PBMIImut remaining was significantly decreased at 3 and 6 h compared with NHE3 WT (*, p < 0.05), but there was no significant change in NHE3 Δ4 compared with NHE3 WT (inset shows results at 3 h). The plasma membrane half-lives are shown in the bottom left. Results are mean ± S.D., n = 3. Error bars represent S.D. C, total half-lives of NHE3 WT, NHE3 PBMIImut, and NHE3 Δ4 were determined with 35S pulse-chase experiments (see “Experimental Procedures”). PS120/NHERF2 cells expressing NHE3 WT, NHE3 PBMIImut, and NHE3 Δ4 were pulse-labeled with Met/Cys-free DMEM containing 0.2 mCi/ml [35S]methionine/cysteine cell-labeling mixture for 4 h and chased in medium containing methionine/cysteine at varying time points (from 0 to 41 h). After solubilization, proteins were immunoprecipitated with monoclonal anti-≤A affinity matrix and subjected to SDS-PAGE. Proteins were transferred to nitrocellulose, and 35S-labeled NHE3 WT, NHE3 PBMIImut, and NHE3 Δ4 were measured with a Storm 860 phosphorimaging system and analyzed with ImageQuant. Results of a single experiment are shown. D, graph showing quantification of autoradiographs for NHE3 WT (■), NHE3 PBMIImut (●), and NHE3 Δ4 (▴). Results are mean ± S.D., n = 3. Error bars represent S.D. There were no significant changes in relative intensities between NHE3 PBMIImut and NHE3 Δ4 compared with NHE3 WT at 4 h (inset). The half-lives are shown in the bottom left. NS, not significant.

