Figure 6.
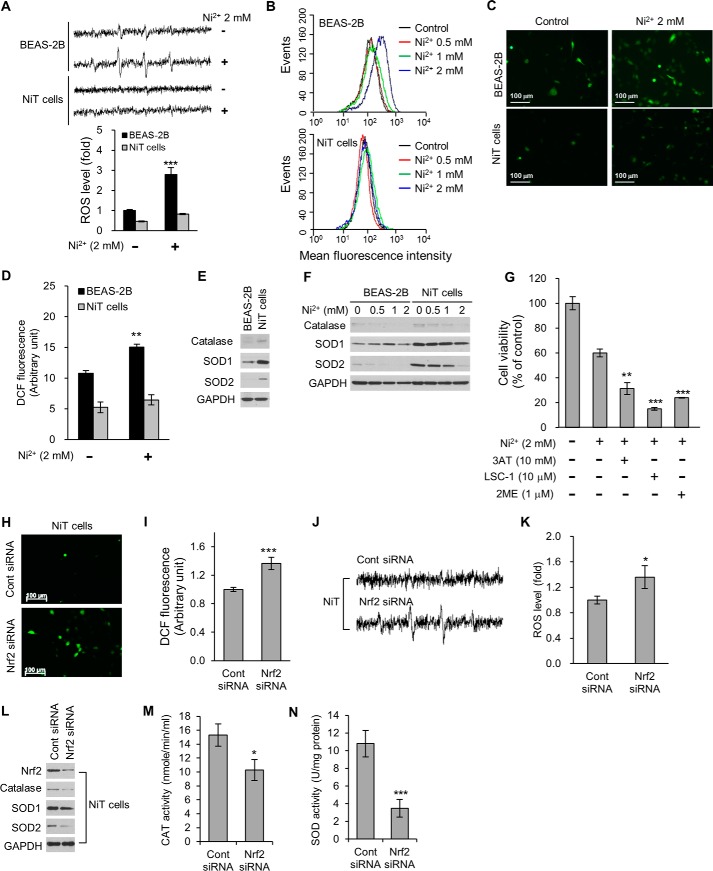
NiT cells have low ROS levels due to the Nrf2-mediated overexpression of antioxidant enzymes. To measure ROS levels, cell suspensions were prepared from BEAS-2B and NiT cells and incubated in the absence or presence with Ni2+ (2 mm) for 6 h. The generation of a 1:2:2:1 quartet ESR signal and the signal intensity of DMPO-OH was demonstrated (A). ROS levels in BEAS-2B and NiT cells were also examined by flow cytometry (B), fluorescence microscopy (C), and fluorescence spectroscopy (D) after staining with CM-H2DCFDA (5 μm) for 30 min. Basal levels of catalase and SODs in BEAS-2B and NiT cells were assessed by Western blot analysis (E). The effects of Ni2+ (0–2 mm) on the levels of antioxidant enzymes in BEAS-2B and NiT cells were also assessed by Western blot analysis (F). To demonstrate inhibition, NiT cells were incubated with Ni2+ (2 mm) for 24 h in the presence or absence of 3AT (10 mm), LCS-1 (10 μm), or 2ME (1 μm), and cell viability was assessed using MTT (G). To examine the involvement of Nrf2 on ROS levels in NiT cells, we transfected these cells with Nrf2-specific siRNA and then evaluated intracellular ROS levels by fluorescence microscopy (H), fluorescence spectroscopy (I), or ESR (J and K). NiT cells were transfected with Nrf2-specific siRNA, and the expression levels (L) and activities (M and N) of the indicated antioxidant enzymes were examined by Western blot analysis. The ESR spectrometer settings were as follows: frequency, 9.8 GHz; power, 39.91 milliwatts; modulation frequency, 100 kHz; receiver gain, 5.02 × 10⁵; time constant, 40.96 ms; modulation amplitude, 1.00 G; scan time, 60 s; and magnetic field, 3451 ± 100 G. All spectra shown are an accumulation of 16 scans. Photomicrographs are representative images of each experimental design. Results are shown as the mean ± S.E. of three separate experiments. *, p < 0.05; **, p < 0.01, and ***, p < 0.001 indicate significant differences determined by ANOVA and Scheffe's test. GAPDH was used as a loading control.

