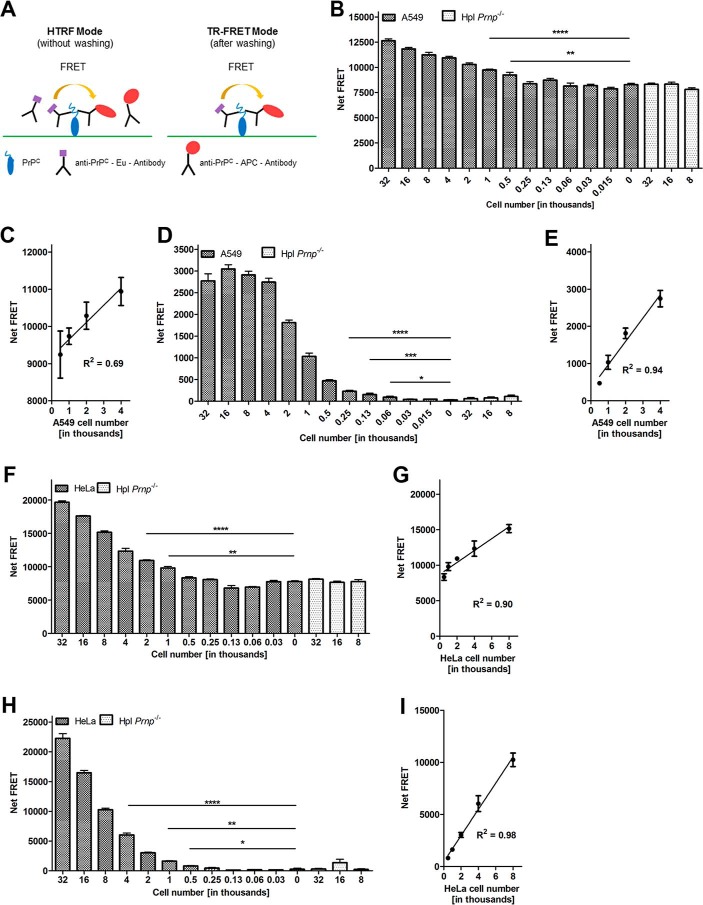
Figure 3.
FRET immunoassay for the detection of PrPC on the cell surface of intact human cells. A, schematic representation of the cell-surface PrPC FRET detection assay. The FRET signal was assessed either in the HTRF mode or after a washing step (TR-FRET mode) to remove unbound chromophore-labeled antibodies. B and F, cell number dilution range in HTRF mode. A549 and HeLa cells were serially diluted (sextuplicates) in DMEM medium starting from 32,000 to 30 cells/well in polystyrene 384-well microtiter plates. Hpl Prnp−/− cells were used as negative controls. C and G, linear range of PrPC cell-surface detection of A549 and HeLa cells in the HTRF mode, respectively. D and H, cell number dilution range of A549 and HeLa cells in TR-FRET mode. E and I, linear range of PrPC cell-surface detection of A549 and HeLa cells in the TR-FRET mode, respectively. Error bars represent the standard deviation (±S.D.) of 6 replicate measurements. Student's t test. *, p < 0.05; **, p < 0.01; ***, p < 0.001; ****, p < 0.0001.

