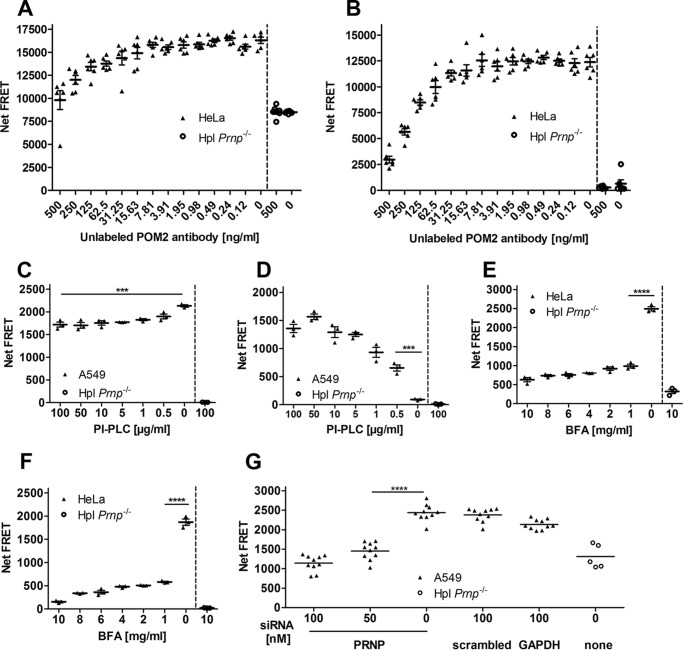
Figure 4.
Suitability test of the FRET immunoassay for the manipulation of PrPC cell-surface expression. A, saturation binding curves of PrPC. A constant number of HeLa cells was incubated with unlabeled POM2 antibody at different concentrations followed by FRET signal detection with POM2-Eu/POM2-APC in HTRF mode. B, saturation binding curves of PrPC after removing unbound POM-2 antibodies (TR-FRET mode). C and D, release of cell-surface PrPC by PI-PLC treatment. A constant number of A549 cells was labeled with POM2-Eu/POM2-APC followed by PI-PLC digestion at various concentrations. PrPC cell-surface FRET signal was measured after PI-PLC treatment at the cell surface (C) as well as in the cell culture medium (D). E, inhibition of PrPC cell-surface expression by BFA treatment. A constant number of HeLa cells was exposed to different BFA concentrations. PrPC cell-surface expression was measured by POM2-Eu/POM2-APC in the HTRF. F, same as E, but in the TR-FRET mode. G, siRNA mediated PRNP knockdown. A549 cells were treated with different concentrations of PRNP siRNA and control siRNAs for 3 days. PrPC cell-surface expression was detected with the POM2-Eu/3F4-APC FRET antibody pair. Scrambled and GAPDH siRNAs as well as Hpl Prnp−/− cells were used as negative and positive controls, respectively. Error bars represent the standard deviation (±S.D.) of six replicate measurements. Student's t test: ***, p < 0.001; ****, p < 0.0001.

