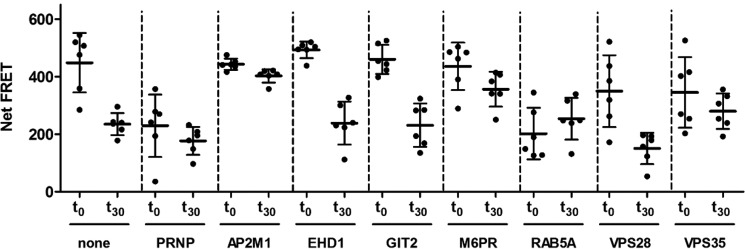
Figure 7.
Manipulation of PrPC endocytosis rate and cell-surface expression by siRNA treatments. A549 cells were treated for 3 days with 50 nm siRNA. PrPC internalization (t0–t30) and cell-surface expression (t0) was measured by FRET using the antibody pair POM2-Eu/POM2-APC, and the endocytosis index (Table 4) was calculated according to the Equation 4 under “Experimental procedures”. Untreated and PRNP siRNA-treated cells were used as controls. Error bars represent the standard deviation (±S.D.) of six replicate measurements. Student's t test.

