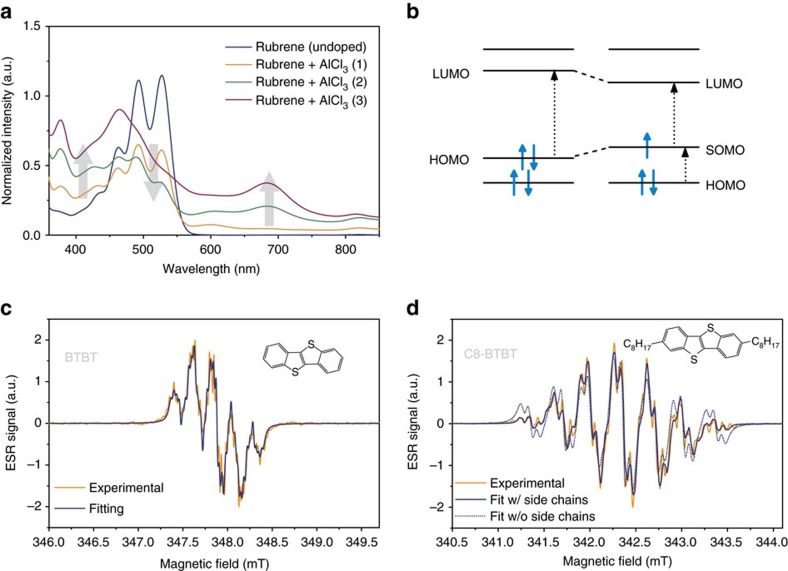
Figure 1. ESR and optical spectra of doped molecules.
(a) Optical absorption spectra of a 0.5 × 10⁻³ mol l−1 solution of rubrene in dichloromethane with increasing amounts of AlCl3 (traces 1–3). We observe the expected bleaching of the transition between the highest occupied molecular orbital (HOMO) and the lowest unoccupied molecular orbital (LUMO) together with the emergence of charge induced transitions in the sub band gap regime from the HOMO to the singly occupied molecular orbital (SOMO). The grey arrows emphasize the increase of charge induced absorption and the decrease of the neutral molecule absorption peaks with higher doping levels. (b) A schematic of energy levels with possible optical transitions for a neutral and positively charged molecule. The shifts of the HOMO and LUMO energy levels reflects the reorganization of the molecular geometry to accommodate the charge. (c,d) Derivative ESR spectra of BTBT and C8-BTBT with best fits including (solid line) or excluding (dashed line) HFI from the first two hydrogens on the side chains.

