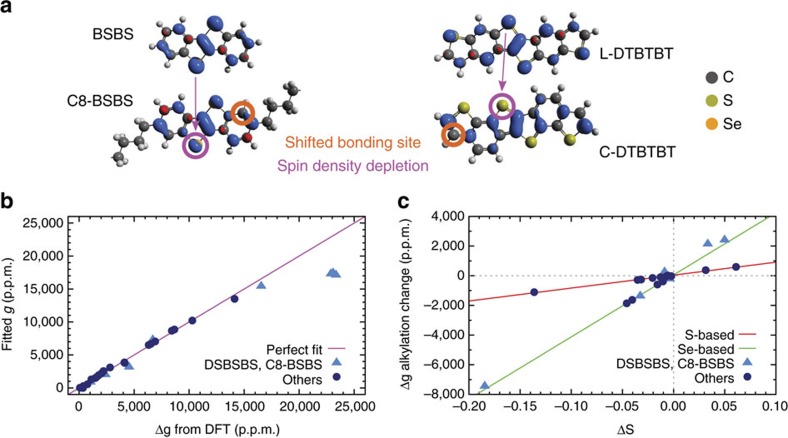
Figure 2. Relationship between g-shift and atomic spin densities.
(a) Spin isodensity contours of cationic (left) BSBS and C8-BSBS, and (right) L-DTBTBT and C-DTBTBT radicals. The C8-BSBS molecule shown has alkyl chains at the outer bonding site. Spin maxima and minima are shown in blue and red, respectively. The shifted bonding site at the phenyl rings has been labelled, and the observed spin depletion at heavy atoms highlighted. Note that only part of the alkyl chains in C8-BSBS are shown. (b) Correlation plot of ΔgOZ/SOC-terms calculated using DFT versus fitted on the form of equation 3. The outliers identified in the text are shown as light blue triangles, with the other numbers represented by dark blue circles. The magenta line y=x represents a perfect fit. For brevity ΔgOZ/SOC has here been relabelled Δg. (c) Plot of changes in ΔgOZ/SOC terms as a function of change of effective heavy atom spin upon alkylation of molecules (see text). Red and green lines represent linear fits to the sulfur- and selenium-based molecules, respectively.

