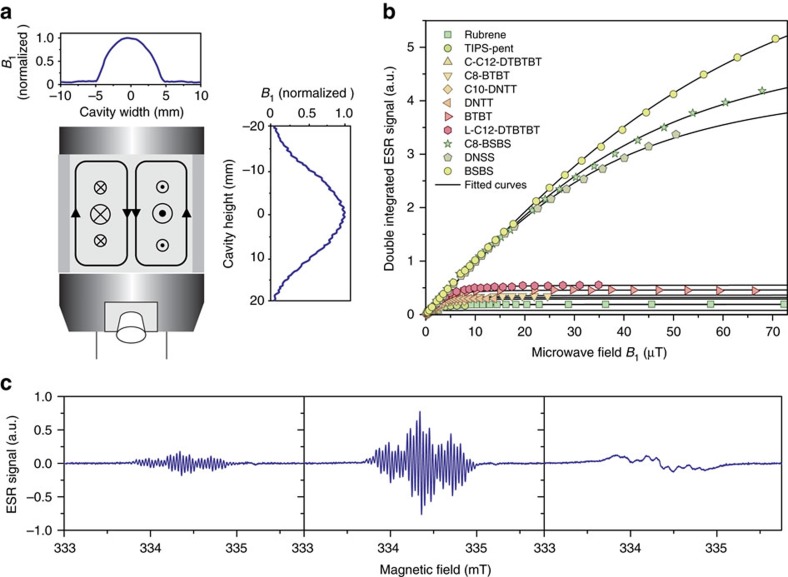
Figure 3. Power-saturation measurement of spin lifetimes.
(a) Schematic of the Bruker ER 4122SHQE cavity with microwave magnetic and electric fields in-plane and out-of-plane, respectively. Plot insets show the magnetic field strength across the cavity. We account for the vertical distribution of B1 and minimize horizontal variations by confining our samples to a diameter of 1 mm. (b) Power saturation of the integrated ESR absorption spectra for the series of molecules with fitted curves to extract T1 and T2. (c) Evolution of derivative ESR spectrum with increasing microwave powers for the example of L-C12-DTBTBT.

