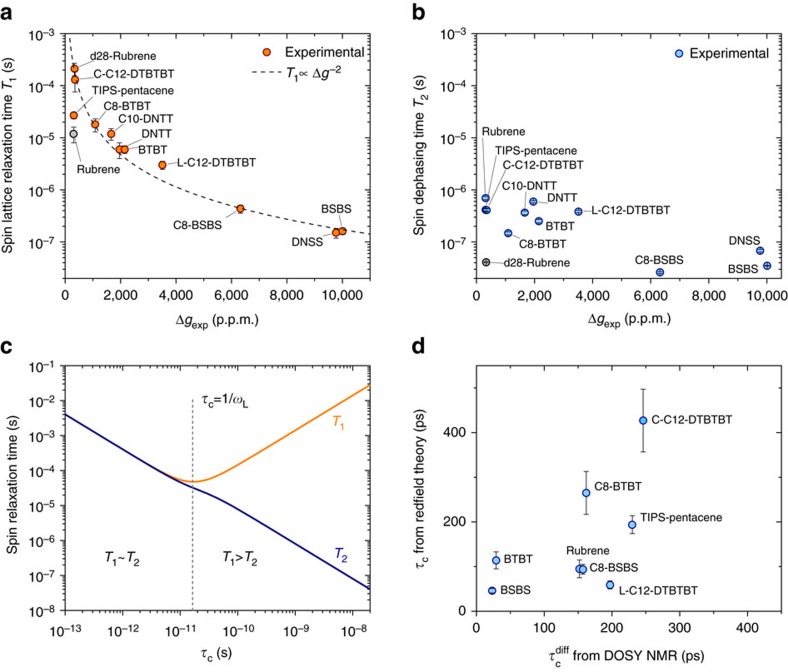
Figure 4. Dependance of spin relaxation times on the effective SOC.
(a) Spin lattice relaxation time versus Δg for all measured molecules. Error bars represent 95% confidence intervals. Dashed line shows the expected proportionality T1∝(Δg)−2 for relaxation via SOC fields. (b) Spin coherence time versus Δg for all measured molecules. Error bars show the 95% confidence intervals. (c) Dependence of T1 and T2 on the correlation time τC of field fluctuations from the Redfield theory. Model values of ωL/2π=9.4 GHz and  were used for the plot. (d) Correlation times τC as estimated from the Redfield theory and plotted against rotational correlation times obtained from DOSY NMR diffusion constants (when available). Error bars from 95% confidence intervals of T1 and T2 and error propagation.

