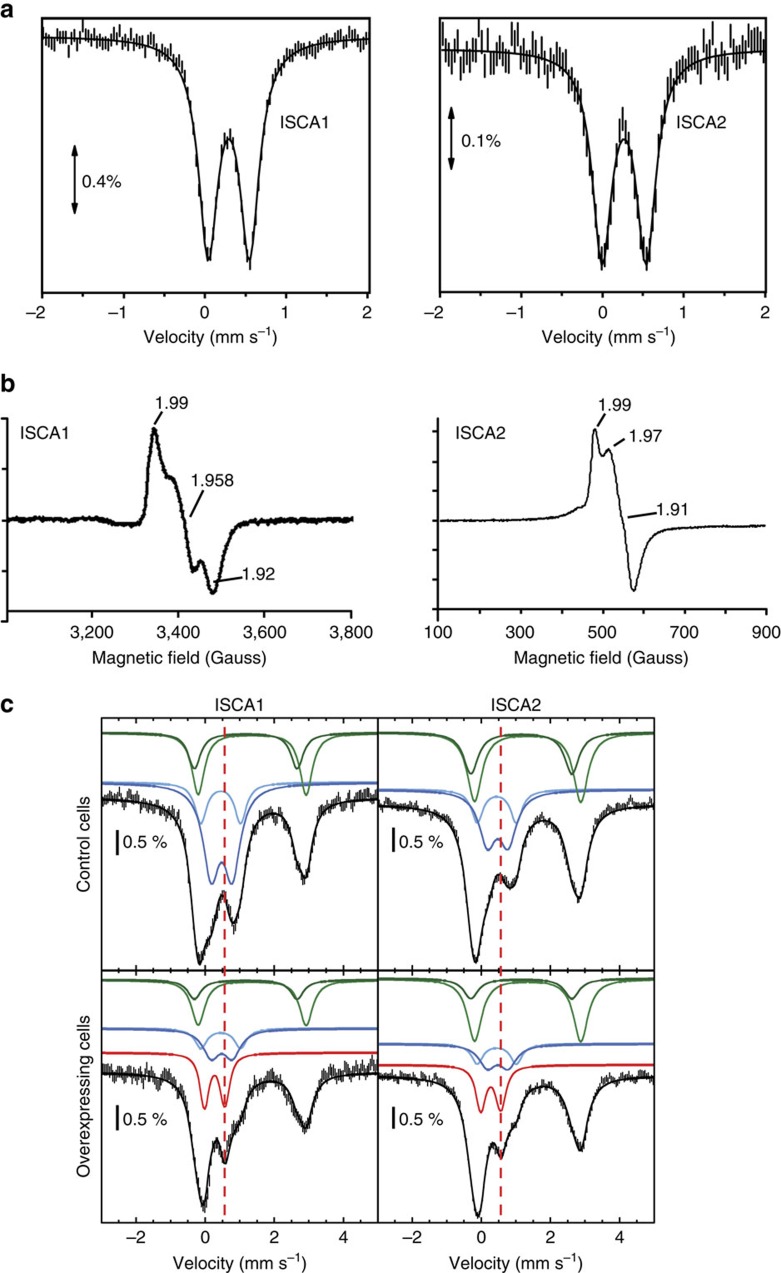
Figure 1. Spectroscopic characterization of ISCA1 and ISCA2.
(a) Mössbauer spectra of the purified 57Fe/S-ISCA1 (1.1 mM, 1 Fe and 0.9 S/protein) and 57Fe/S-ISCA2 (380 μM, 0.7 Fe and 0.65 S/protein). Mössbauer spectra were recorded at 4.2 K in a magnetic field of 83 and 60 mT applied perpendicular to the γ-beam for ISCA1 and ISCA2, respectively. The solid lines correspond to simulation of the experimental spectra. (b) X-band EPR spectra of as-isolated ISCA1 (250 μM) and ISCA2 (500 μM) after reduction with 1 mM dithionite for 10 min. (c) Mössbauer spectra recorded on whole control cells (upper panels) and ISCA1 or ISCA2-overexpressing cells (lower panels) at 5.5 K using a 60 mT external magnetic field applied parallel to the γ-beam. Experimental spectra are shown with hatched marks and simulations are overlaid as solid black lines. Five components were used for simulation: HS FeII (light and dark green), Fe4S4 clusters and LS ferrous haems (light blue), FeIII NP (dark blue) and [Fe2S2]2+ (red) (see Table 1 for parameter values).

