. 2017 Mar 21;6:e23644. doi: 10.7554/eLife.23644

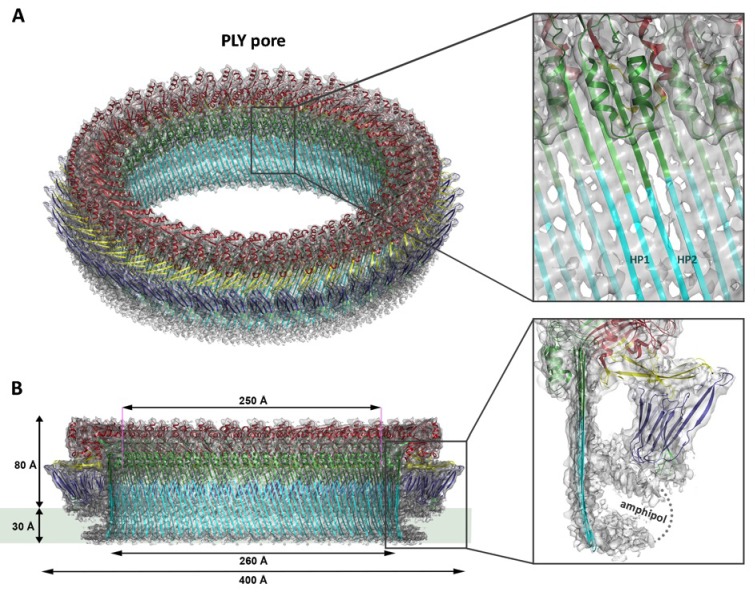
Figure 1. Overall structure of the PLY pore complex.

(A) Single-particle cryoEM map of PLY at 4.5 Å resolution with fitted model. The four PLY domains (D1–D4) are red (D1), yellow (D2), green/cyan (D3) and blue (D4). Inset: refolded β-hairpins (HP1 and HP2) fitted to the map. Cyan β-strands have refolded from helix bundles in D3 of the soluble form. (B) Cross-section with overall dimensions of the pore complex. The grey bar indicates the position of the lipid bilayer. Inset: side view of membrane-inserted monomer with toroid density of disordered amphipol (broken line).

DOI: http://dx.doi.org/10.7554/eLife.23644.002

Figure 1.

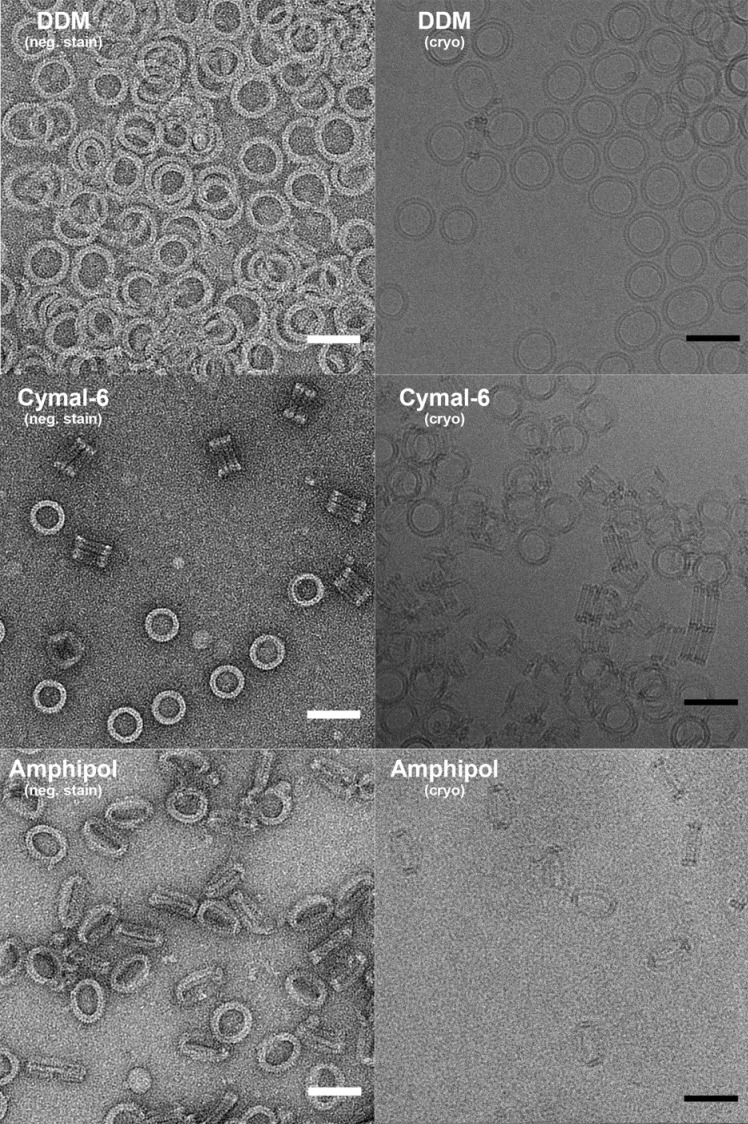
Figure 1—figure supplement 1. Negative stain and cryoEM of PLY solubilized in DDM, Cymal-6 and Amphipol.

Figure 1—figure supplement 1.

PLY rings solubilized with DDM vary in size and tend to orient on the specimen support or the air/water interface. Rings solubilized with Cymal-6 are more homogenous in size but tend to stack in pairs. Exchange of detergent against Amphipol A8-35 results in uniform, randomly oriented, single PLY rings. Scale bar: 50 nm.
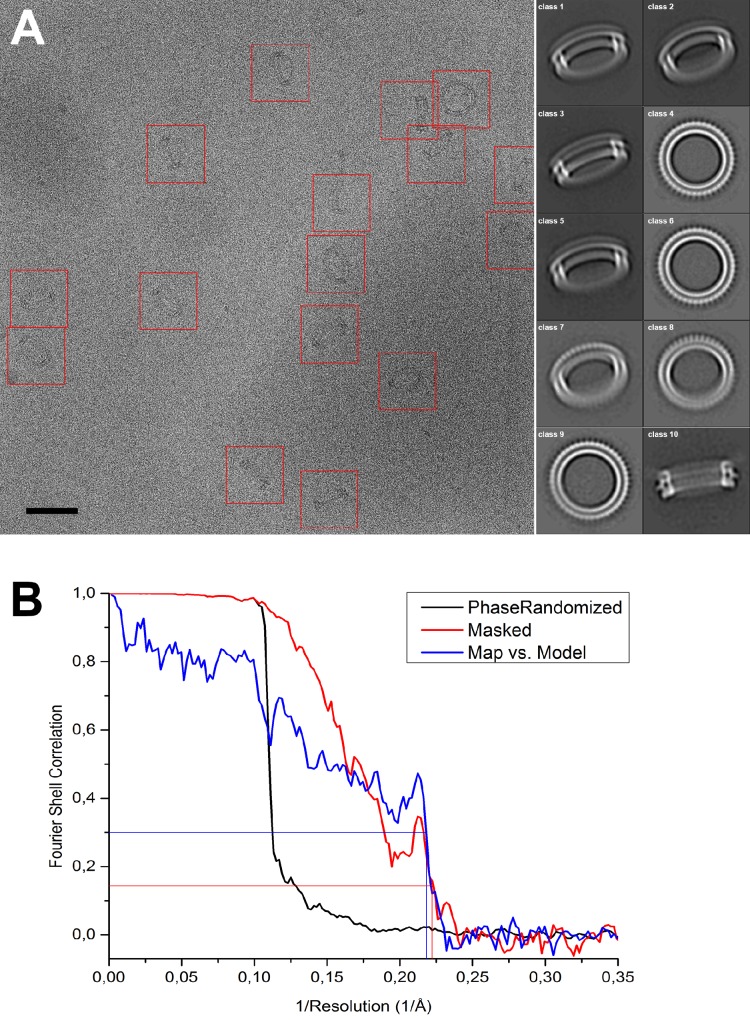
Figure 1—figure supplement 2. Image processing of PLY rings.

Figure 1—figure supplement 2.

(A) Sample micrograph of amphipol-solubilized PLY rings picked for single-particle processing (red boxes). Scale bar: 50 nm. Class averages after 2D classification are shown on the right. (B) FSC curve for phase-randomized, masked map (red curve) indicates 4.5 Å resolution by the FSC0.143 criterion (red line). The sharp peak at 4.8 Å, reflecting the repeat distance between the 168 β-strands in the β-barrel, and a steep drop beyond that, indicating a resolution of 4.5 Å at the 0.143 theshold for the masked FSC, and of 4.6 Å at the 0.3 threshold for the map-vs-model FSC. The two values are in excellent agreement.
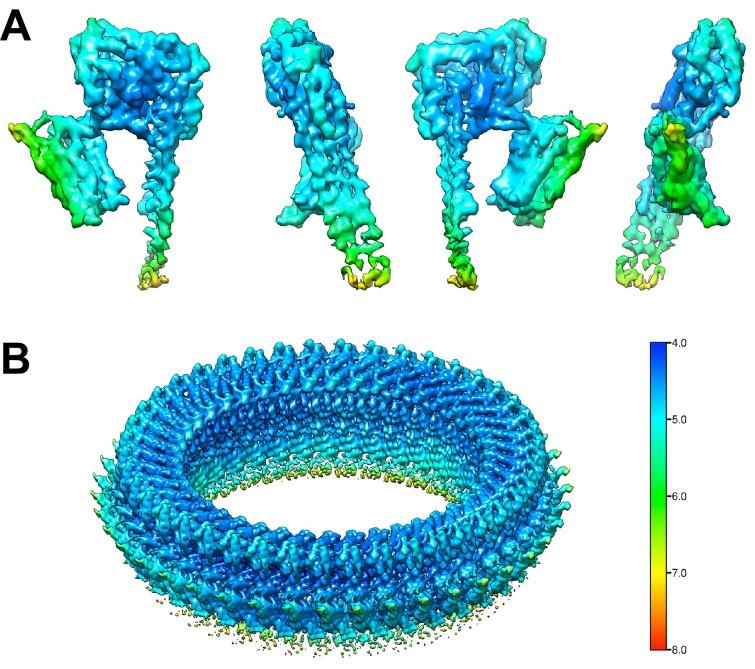
Figure 1—figure supplement 3. Local resolution estimate of the PLY monomers and of the complete pore complex.

Figure 1—figure supplement 3.

(A) Local resolution map of one PLY monomer from the final density map of the pore complex. The monomer is rotated in 90° steps around the y-axis. (B) Local resolution map of the PLY pore complex.