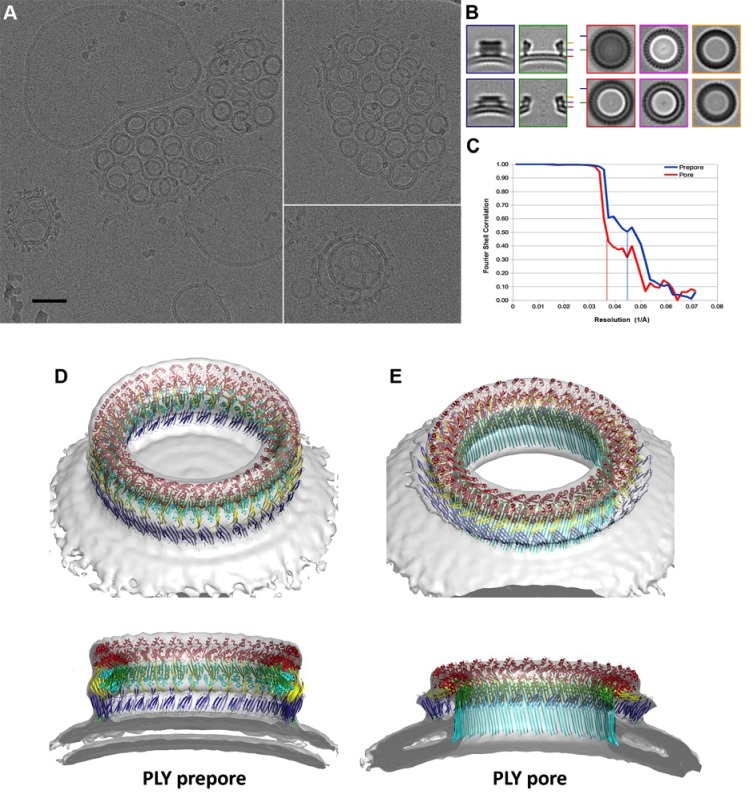
Figure 6. CryoET of PLY prepores and pores.
(A) PLY assembles into prepores and pores upon incubation with cholesterol-containing liposomes. Scale bar, 50 nm. (B) Sections through subtomogram average volumes of the prepore (top) and pore complex (below). Left panel: sections perpendicular to the membrane; right panel: sections parallel to the membrane. Colors indicate section planes. (C) Fourier shell correlation for subtomogram averages indicate 22 Å resolution for the prepore and 27 Å for the pore at FSC0.5 or 20 Å and 21 Å resolution at at FSC0.3. Oblique view (D) and cross section (E) of PLY prepore (left) and pore (right). Both maps accommodate 34 PLY monomers. The prepore map was fitted with the crystal structure of the soluble PLY monomer (Marshall et al., 2015), and the pore map with the cryoEM structure of the pore monomer (Figure 2A). PLY domains are red (D1), yellow (D2), green/cyan (D3) and blue (D4). The lipid bilayer is continuous in the prepore complex, but absent in the pore complex.


