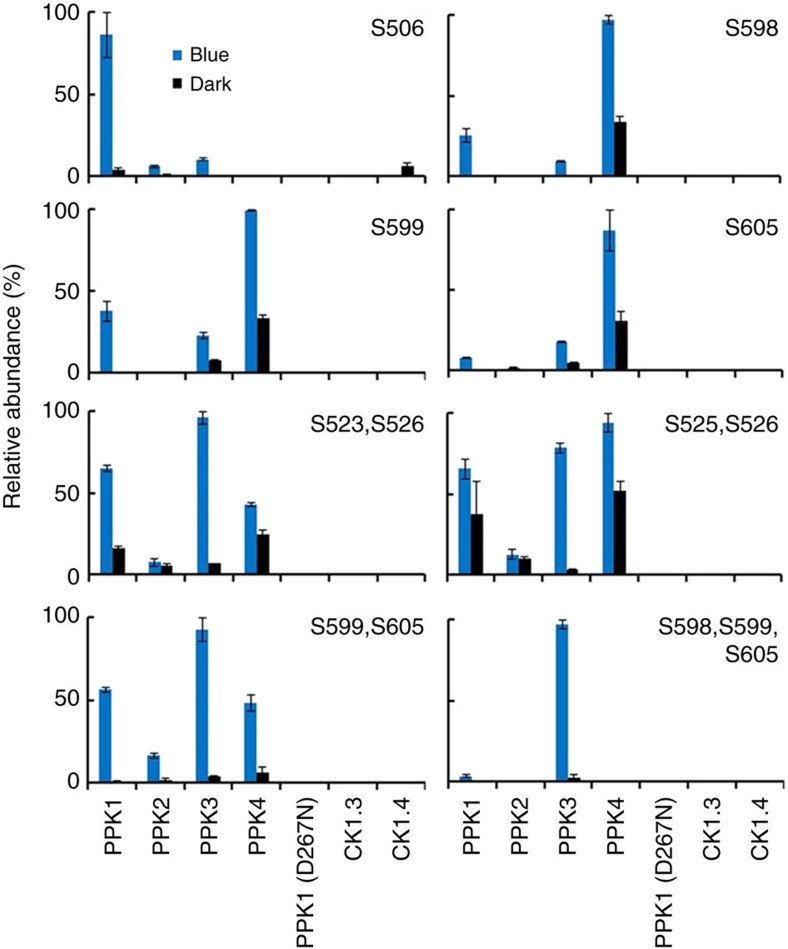
Figure 6. MS analyses of the phosphosites of PPK-catalysed phosphorylation of CRY2.
HEK293T cells co-expressing CRY2 and a Flag-tagged PPK indicated, CK1.3, CK1.4, or the catalytically inactive PPK1D267N mutant (PPK1-D267N) were exposed to blue light (30 μmol m−2 s−1, 120 min) (blue bars) or kept in the dark (black bars). Phosphopeptides of CRY2 purified from individual samples were analysed by the label-free quantitative MS, and the most abundant phosphopeptides detected in this experiment are shown. The lack of a bar indicates that the peptide/protein was not detected. The intensity of each phosphopeptide was quantified by PRM, analysed by the Skyline software, normalized against total ion current, and converted to relative abundance as described in Fig. 1a. Three biological replicates are analysed and the standard deviations are shown (n=3).

