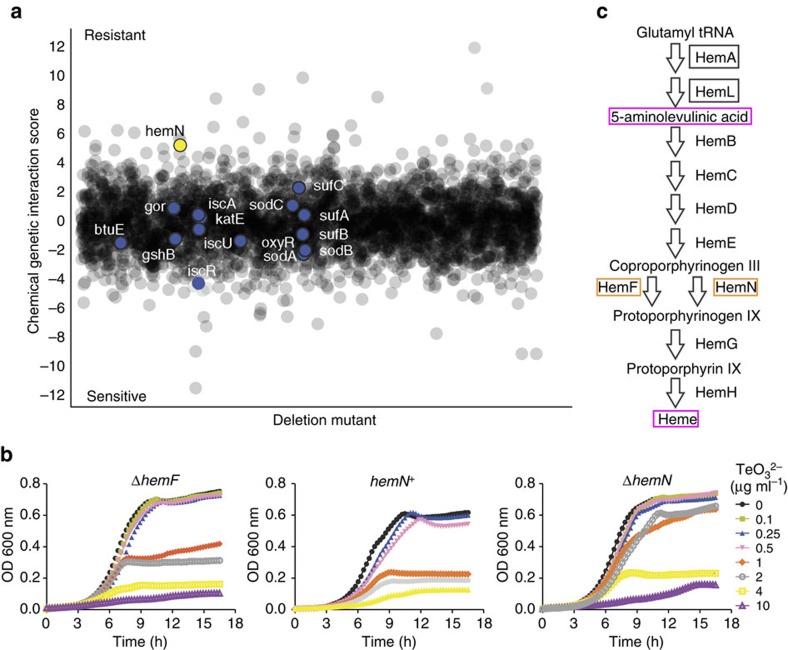
Figure 2. Chemical genomics of tellurite.
(a) Treatment of the E. coli barcoded deletion collection with tellurite. Positive or negative chemical genetic interaction scores represent increased or decreased tellurite resistance, respectively. Selected deletion mutants of genes encoding proteins required for heme biosynthesis (hemN; yellow circle), glutathione metabolism (gor, gshB), ROS resistance (btuE, oxyR, sodA, sodB sodC, katE) and iron–sulfur cluster assembly (iscA, iscR, iscU, sufA, sufB, sufC) are indicated. (b) Representative growth curves of strains ΔhemF, hemN+ and ΔhemN in M9 medium in the presence of the indicated tellurite concentrations. Values represent the mean of three biological replicates. s.d. was removed for clarity (growth curves with s.d. are shown in Supplementary Fig. 4). (c) Schematic representation of heme biosynthetic pathway in E. coli BW25113. Selected proteins encoded by genes that when inactivated (orange box) or mutated (black box) increased tellurite resistance or heme biosynthetic intermediates (magenta box) that showed altered levels in strain EM2 are highlighted. TeO32−: tellurite.

