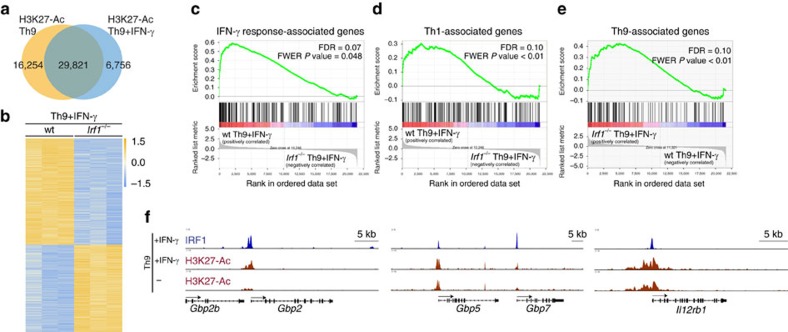
Figure 4. The IFN-γ/IRF1 pathway upregulates IFN/Th1-associated genes in Th9 cells.
(a) ChIP-Seq analyses of Th9 cells with or without IFN-γ treatment. Cells were crosslinked with formaldehyde and immunoprecipitated with anti-H3K27-Ac antibodies. Massive parallel sequencing of immunoprecipitated DNA was performed. Numbers in the Venn diagram represent H3K27-Ac peaks. (b) Naive CD4+ T cells isolated from WT and Irf1−/− mice were cultured under Th9 conditions in the presence of IFN-γ. Total RNA was purified from the cells and RNA-Seq was performed (three independent biological samples). Heatmap shows colour-coded z-scored fragments per kilobase of exon per million fragments mapped (P<0.01). (b–d) GSEA was performed according to the Broad institute with (c) the hallmark IFN-γ response, (d) Th1 upregulated genes and (e) Th9 upregulated genes. (f) ChIP-Seq analysis of Th9 cells with or without IFN-γ treatment. Cells were crosslinked with formaldehyde and immunoprecipitated with anti-IRF1 (upper lanes) or anti-H3K27Ac antibody (middle and bottom lanes). Transcription start site of genes are indicated below as arrows.

