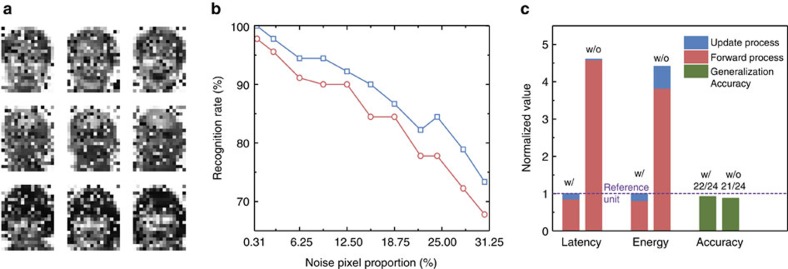
Figure 5. The test result with latency and energy comparison.
(a) A standard example of the constructed test patterns with 100 noise pixels with respect to each training image in Fig. 2c. (b) The recognition rate curve of two programming strategies during the test. The x axis represents the amount of noise. (c) The comparison between with (W/) and without (W/O) schemes in terms of latency and energy consumption during training process and testing recognition rate in the normalized format.

