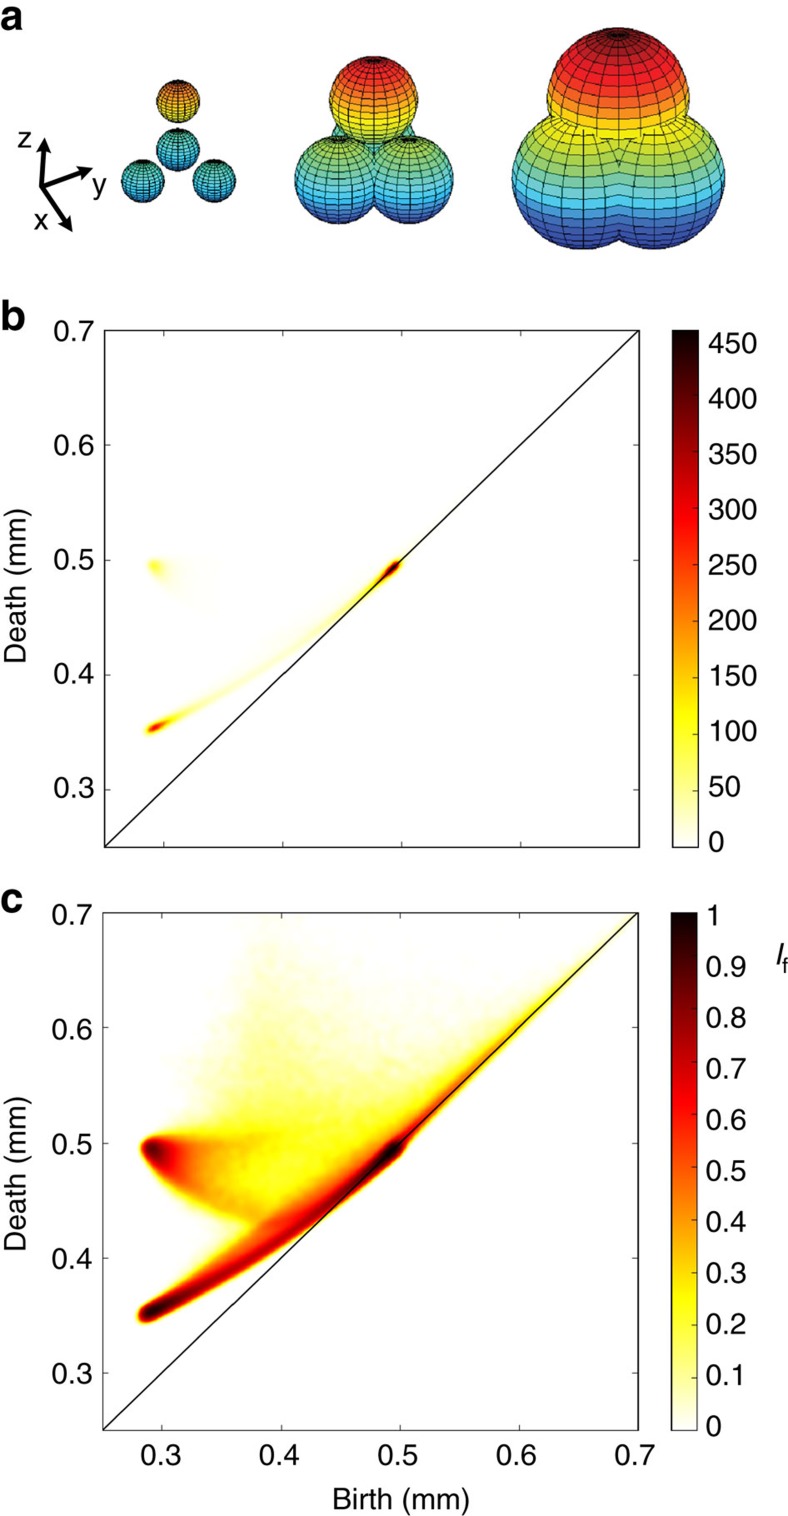
Figure 2. Persistence diagrams.
(a) Tetrahedral configuration of mathematical balls with growing radius α. Colour changes from blue to red with increasing z value. (b) Persistence diagram PD2 as a probability density function of pores indicating via the colour map the occurence rate P of a given grain configuration at a specific (b,d) pair. PD2 is plotted for a packing with a density of φ=0.685. (c) PD2 for the same packing, the rate of occurence is now expressed in terms of the frequency index If=log((log(P+1))+1)/IfM to highlight the fine details of the diagram.

