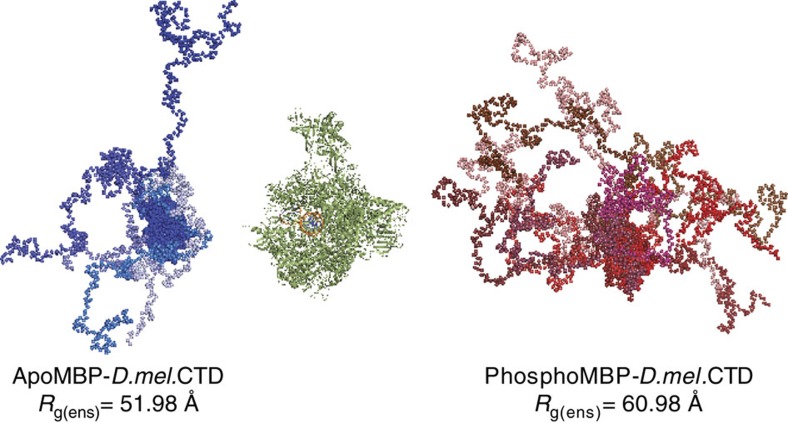
Figure 3. Ensemble optimization models depicting CTD extension.
Averaged apo and phospho MBP-D.melCTD scattering data were modelled using EOM 2.1 from the ATSAS suite31. Individual models in the apo and phospho ensembles are shown in shades of blue and red, respectively, oriented by MBP and positioned adjacent to the 12 subunit RNA Pol II elongation complex (1Y1W.pdb) model (green) for scale.

