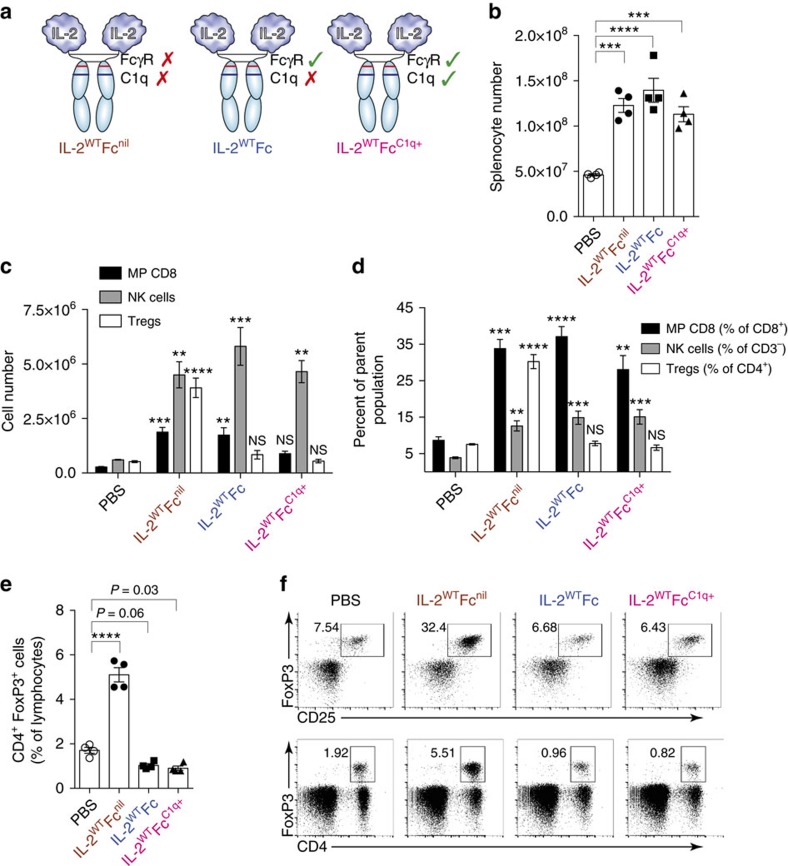
Figure 3. IL-2WTFc selectively depletes Tregs in a FcγR-dependent manner.
(a) Diagram of produced IL-2-Fc variants showing FcγR and C1q-binding site status. Mutated residues within the Fc region are illustrated in Supplementary Fig. 7A. (b–f) Analysis of spleens (day 5) collected from C57BL/6 mice treated with five consecutive 5.6 μg i.p. injections of IL-2WTFcnil, IL-2WTFc, IL-2WTFcC1q+ or PBS control on days 0–4 (n=4). (b) Total live splenocytes counts showing increased lymphoid cellularity after IL-2-Fc treatment. (c–f) Flow cytometric analysis of collected splenocytes. (c) Total cell numbers of MP CD8 (CD8+ CD44high CD122high), NK cell (CD3− NK1.1+ CD122high) and Treg (CD4+ FoxP3+ CD25+) cell subsets. (d) Frequencies of MP CD8 (shown as proportion of CD8+), NK cells (proportion of CD3−) and Tregs (proportion of CD4+). (e) Frequencies of CD4+ FoxP3+ cells within the lymphocyte compartment showing depletion of this subset after treatment with FcγR-binding IL-2-Fc constructs. (f) Representative flow cytometry dot plots displaying the frequency of regulatory T-cells in treated mice as defined by the co-expression of CD4, FoxP3 and the IL-2-inducible CD25 surface marker (top row, shown as proportion of CD4+) or by expression of CD4 and FoxP3 (bottom row, shown as proportion of total lymphocytes). Data are displayed as mean±s.e.m. Asterisks indicate significant differences relative to PBS controls (c,d) or between specified groups (b,e) as determined by one-way analysis of variance with Bonferroni post hoc test for multiple comparisons (**P<0.01, ***P<0.001, ****P<0.0001).

